Uncertainty looms ahead of economic data

Friday’s trading session saw little change, with the S&P 500 index remaining near its Thursday closing price (-0.14%). Although the market hit a new record high of 5,261.10 on Thursday, it only gained 0.3% after retracting some of its intraday advance. Last week, stock prices were influenced by the FOMC Rate Decision on Wednesday; this week, investors are bracing for a series of economic data releases, including tomorrow’s CB Consumer Confidence, Thursday’s GDP and Friday’s Core PCE Price Index.
This morning, the S&P 500 futures contract is lower by 0.3%, indicating a lower opening for the index. Consequently, the market is likely to retrace more of its post-Fed rally. The question remains: will the Thursday’s surge lead to a short-term or intraday downward correction and a potential retracement of the advance? From a contrarian standpoint, such a correction seems likely, but the overall trend remains bullish.
On March 1, I mentioned about February, “Despite concerns about stock valuations, the market rallied to new record highs, fueled by hopes of the Fed's monetary policy pivot and the AI revolution.”. And last week, it was all about that Fed pivot, hence a positive market reaction. The S&P 500 index seems to be crawling a wall of worry here.
While indexes were hitting new record highs, most stocks were essentially moving sideways. So, the question is – is this a topping pattern before a more meaningful correction? Still, there have been no confirmed negative signals; however, one might consider the possibility of a trend reversal.
Quite surprisingly, the investor sentiment worsened a bit; last Wednesday’s AAII Investor Sentiment Survey showed that 43.2% of individual investors are bullish, while 27.2% of them are bearish, up from 21.9% last week. The AAII sentiment is a contrary indicator in the sense that highly bullish readings may suggest excessive complacency and a lack of fear in the market. Conversely, bearish readings are favorable for market upturns.
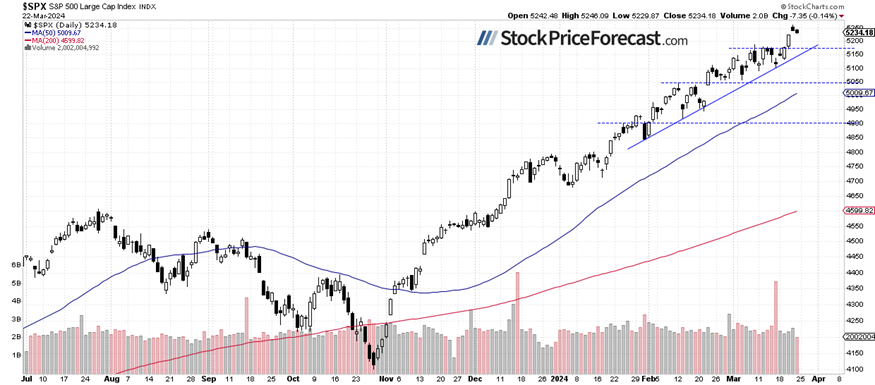
Recently, the S&P 500 index bounced from an over month-long upward trend line, as we can see on the daily chart.
S&P 500 gained over 2% last week
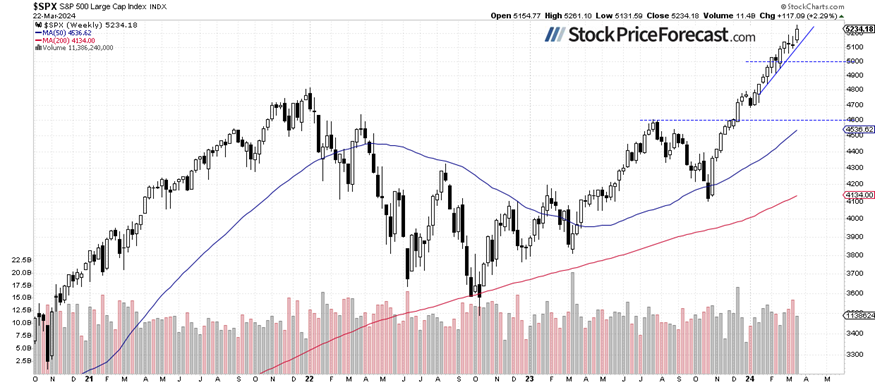
Compared to the previous Friday’s closing price, the index gained 2.29%, accelerating its medium-term uptrend, while getting further away from its upward trend line. However, the retreat on Thursday and Friday may be suggesting that the market may be topping, though no clearly negative signals are evident yet.
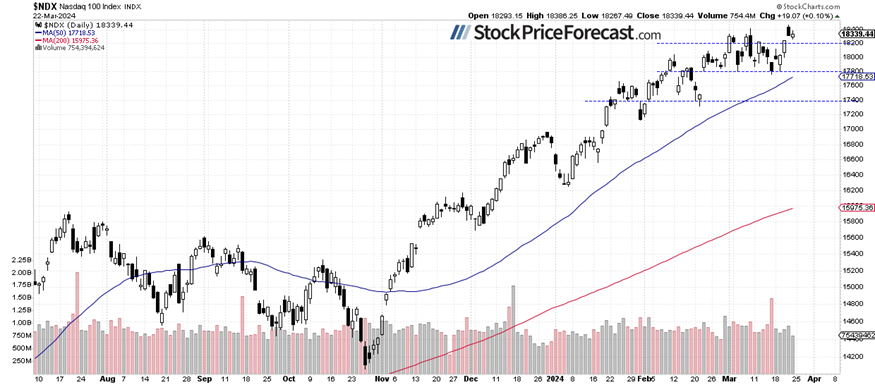
Nasdaq 100 remains relatively weaker
On Thursday, the technology-focused Nasdaq 100 index reached a new record high of 18,464.70, extending its long-term uptrend yet again. However, it retraced most of the intraday advance, and it went back below a local high from March 8. The market retreated back within the recent consolidation, indicating a failed breakout attempt.
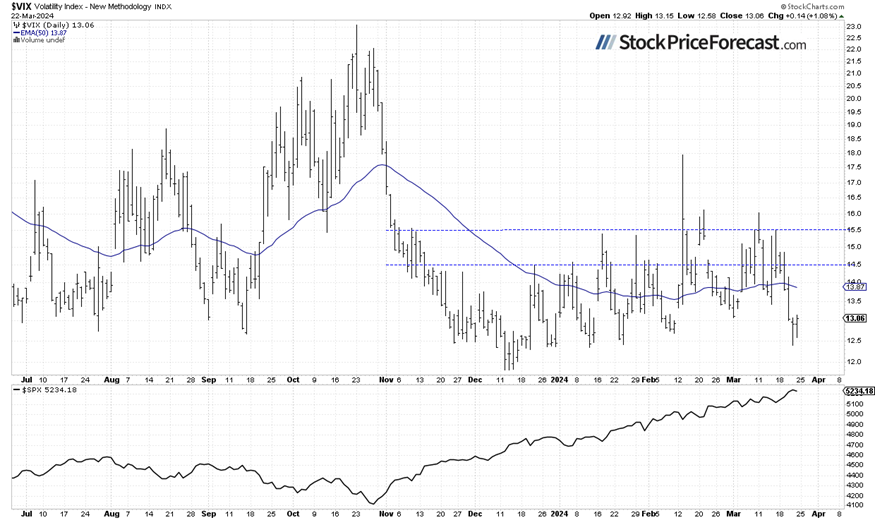
VIX fluctuates along 13
The VIX index, also known as the fear gauge, is derived from option prices. On Thursday, the index dipped slightly below the 12.50 level, before bouncing closer to 13 later in the day. It was the lowest since mid-January, indicating a lack of fear in the market. On Friday, it basically remained near the 13 level, despite a slight correction in stock prices.
Historically, a dropping VIX indicates less fear in the market, and rising VIX accompanies stock market downturns. However, the lower the VIX, the higher the probability of the market’s downward reversal.
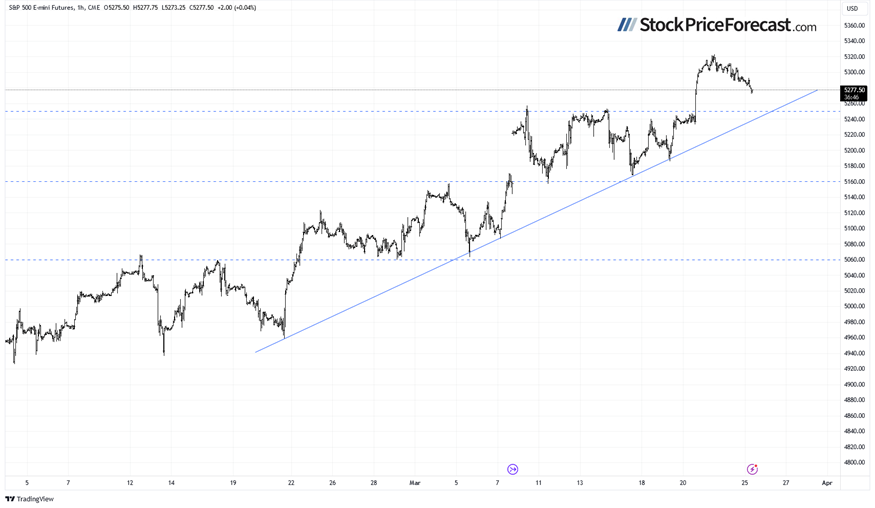
Futures contract retreats below 5,300
Let’s take a look at the hourly chart of the S&P 500 futures contract. On Wednesday, it broke above the recent trading range as markets reacted to the FOMC release. Since then, it has been retracing the advance, and this morning, it’s trading below the 5,300 level. The support level remains at 5,260, marked by the previous highs.
Conclusion
Today, the S&P 500 index is likely to open 0.3% lower following a weakness on Thursday and Friday. More pronounced profit-taking action may be in cards at some point. However, as of now, there have been no confirmed negative signals.
In my Stock Price Forecast for March, I noted “So far, stock prices have been trending upwards in the medium to long term, reaching new record highs. The prudent advice one could give right now is to remain bullish or stay on the sidelines if one believes stocks are becoming overvalued and may need a correction. It's likely that the S&P 500 will continue its bull run this month. However, we may encounter a correction or increased volatility at some point as investors start to take profits off the table.”
For now, my short-term outlook remains neutral.
Here’s the breakdown:
-
The S&P 500 is likely to extend a retreat from Thursday’s record high.
-
Stock prices are getting more overbought, and another short-term correction may be coming.
-
In my opinion, the short-term outlook is neutral.
The full version of today’s analysis - today’s Stock Trading Alert - is bigger than what you read above, and it includes the additional analysis of the Apple (AAPL) stock and the current S&P 500 futures contract position. I encourage you to subscribe and read the details today. Stocks Trading Alerts are also a part of our Diamond Package that includes Gold Trading Alerts and Oil Trading Alerts.
Want free follow-ups to the above article and details not available to 99%+ investors? Sign up to our free newsletter today!
Want free follow-ups to the above article and details not available to 99%+ investors? Sign up to our free newsletter today!
Author

Paul Rejczak
Sunshine Profits
Paul Rejczak is a stock market strategist who has been known for the quality of his technical and fundamental analysis since the late nineties.


