Stocks rebounded: What’s next?

Tuesday's trading session was mixed; stock prices bounced, but they closed well below the daily highs. The S&P 500 reached a local high of 5,312.34 but closed more than 70 points below that level, gaining 'just' 1.04%. Overnight, calming words from the Bank of Japan were released, and this morning, the S&P 500 is likely to open 1.0% higher in another attempt to retrace more of its recent sell-off.
Before the current turmoil, investor sentiment had slightly improved last week, as indicated by the last Wednesday's AAII Investor Sentiment Survey, which showed that 44.9% of individual investors are bullish, while only 25.2% of them are bearish – down from 31.7% last week.
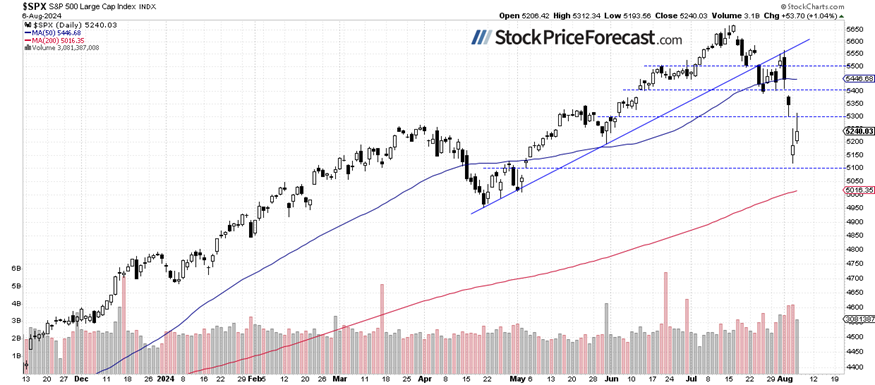
The S&P 500 index rebounded from the 5,300 level yesterday, as we can see on the daily chart.
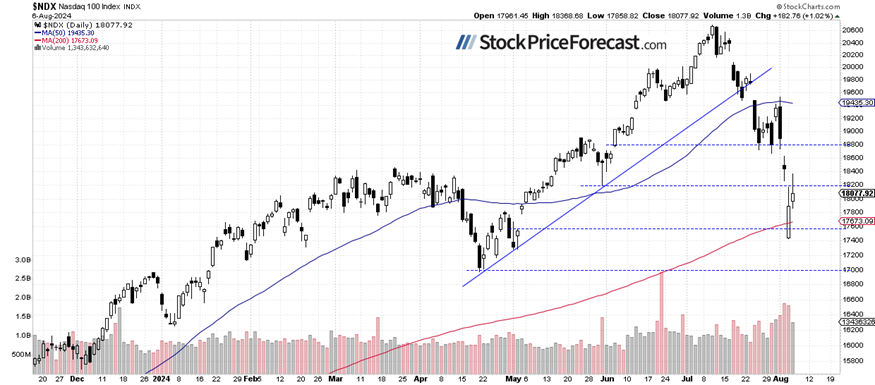
Nasdaq 100: Back above 18,000
Yesterday, the technology-focused Nasdaq 100 gained 1.02%, but it retraced most of the intraday rally. This morning, it is likely to open 1.3% higher. There will be more volatility as the recent sell-off was quite extraordinary, and the damage has been done. It’s likely that the market will experience a consolidation, although many investors hope for a V-shaped rally from the current levels.
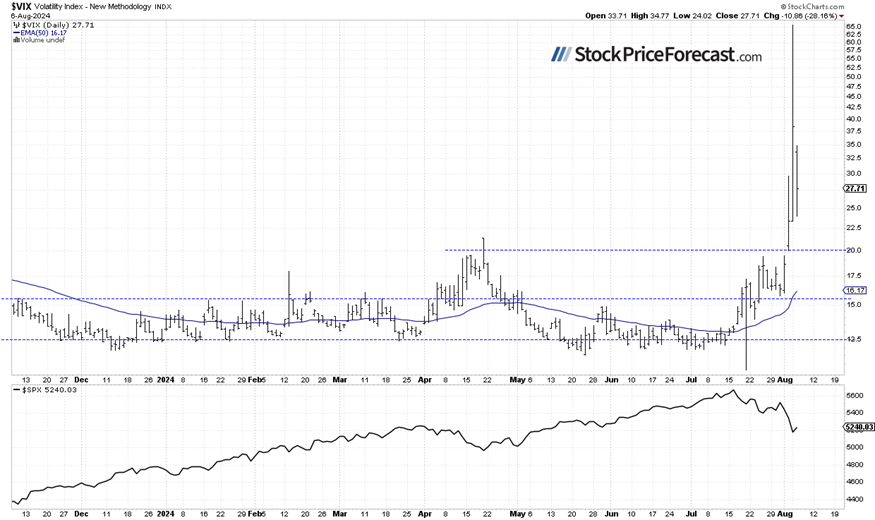
VIX remains elevated
The VIX index, a measure of market fear, accelerated its advance on Friday, nearing 30, and on Monday reached as high as 65.73—the highest level since the 2008 financial crisis and the COVID sell-off in 2020. This reflected significant fear in the market. Yesterday, the VIX pulled back to below 30 again, yet it remains high, indicating continued fear in the market.
Historically, a dropping VIX indicates less fear in the market, and rising VIX accompanies stock market downturns. However, the lower the VIX, the higher the probability of the market’s downward reversal. Conversely, the higher the VIX, the higher the probability of the market’s upward reversal.
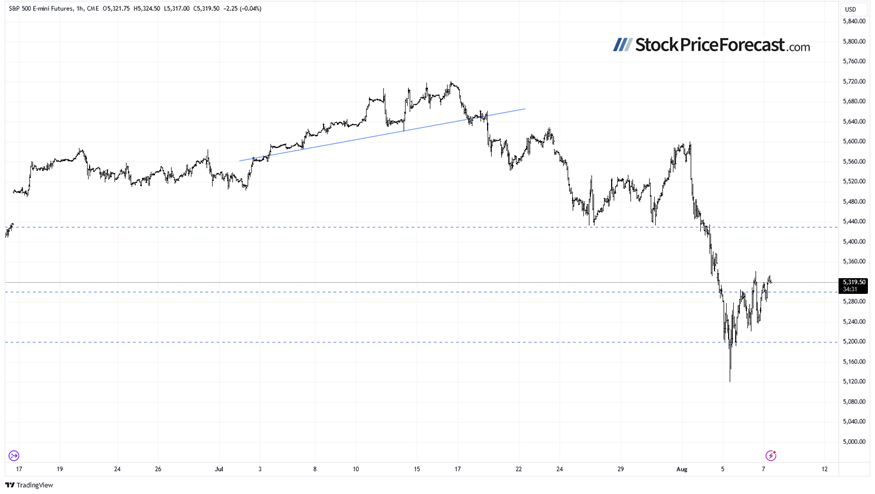
Futures contract: Above 2,300 again
Let’s take a look at the hourly chart of the S&P 500 futures contract. On Monday, it traded as low as 5,120, and yesterday, it rebounded to a local high of 5,342. The market then experienced a quick correction before rebounding again on calming comments from the BOJ. This morning, the contract is trading above 5,300, but the bulls are certainly not out of the woods yet. The nearest important resistance level is at 5,400-5,440, marked by the previous local lows.
Conclusion
In my Stock Price Forecast for August on Friday, I noted “a sharp reversal occurred, and by the end of the month, the S&P 500 experienced significant volatility following the sell-off. August is beginning on a very bearish note, but the market may find a local bottom at some point.”
Wednesday’s trading session is likely to open higher, but given yesterday’s late-day retreat, the market is likely to extend its consolidation after rebounding from Monday’s low. The most likely scenario appears to be a short-term consolidation, which could take the form of a bottoming pattern (bullish case) or simply a flat correction of the downtrend before another leg lower.
My short-term outlook is now neutral.
Here’s the breakdown:
-
The S&P 500 index accelerated its sell-off on Monday, reaching its lowest level since early May.
-
The market found a short-term bottom, but this may only be temporary; no positive signals are evident.
-
In my opinion, the short-term outlook is neutral.
Want free follow-ups to the above article and details not available to 99%+ investors? Sign up to our free newsletter today!
Want free follow-ups to the above article and details not available to 99%+ investors? Sign up to our free newsletter today!
Author

Paul Rejczak
Sunshine Profits
Paul Rejczak is a stock market strategist who has been known for the quality of his technical and fundamental analysis since the late nineties.


