SPX explodes 160+ points [Video]
![SPX explodes 160+ points [Video]](https://editorial.fxsstatic.com/images/i/supermicro-01.jpg)
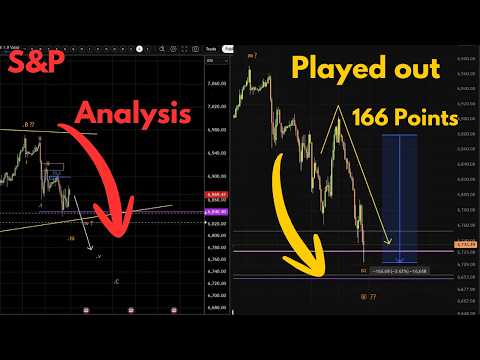
In this video we review an S&P 500 bearish forecast from our private webinar that later resulted in a 166-point market drop.
We are seeing what looks to be a bearish Elliott Wave structure where the market was expected to form an A down – B sideways triangle – C down pattern. The analysis suggested that once the triangle structure (.A .B .C .D .E) completed, the market would likely break below the key trendline and move lower.
The key expectation was:
- Break below the yellow trendline.
- Confirmation of bearish momentum.
- Targets below 6737.
As shown at the end of the video, the market played out exactly as anticipated, producing a 166-point downward move after the setup was identified. This example demonstrates how high-time-frame structure and disciplined analysis can help identify high-probability opportunities in the market.
Author

Neerav Yadav
50 Eyes Market Analysis
Neerav Yadav is a Futures trader who is in the markets since 2014 and trades primarily in Energy Futures, Gold, Indices, Stocks and other instruments.


