S&P 500 (SPX) can continue advancing but is beginning to look stretched
- S&P 500 keeps rallying but risk/reward starts to look stretched.
- This week we get retail earnings from Walmart, Home Depot.
- Seasonality is on the the side of bulls.
The recovery in the stock market continued on Friday, but the moves were more subdued due to the effects of the bond market being closed during Veteran's Day. That took the main catalyst for the equity rally away from bulls. The repricing of Fed rate predictions has led to a massive short-covering rally across sectors.
S&P 500 (SPY) news
This rally, like the one in the summer, is now beginning to look stretched. The summer rally was 19%, while this latest one approaches 15% from the lows in October. We have moved from negative sentiment readings and positions to a more balanced view. The seasonality factor is still at play, but entering fresh longs up here looks like a FOMO trade to me. This week we will see how retail is faring as Walmart and other retailers report earnings. In times of inflation low-income consumers suffer first before it eventually moves up the chain. The wave of layoffs in tech will eventually likely be felt in jobs numbers and consumer sentiment and spending, but that is likely an early 2023 event.
S&P 500 (SPY) forecast
AAII Sentiment Survey:
— AAII SentimentSurvey (@AAIISentiment) October 13, 2022
*This week's bullish sentiment reading ranks among the 60 lowest in the survey's history
*There have been fewer than 35 bearish sentiment readings at or above 55% since the survey started in 1987https://t.co/CPRW7PTvl4 pic.twitter.com/7ynQGhvfDg
October AAII Asset Allocation Survey:
— AAII SentimentSurvey (@AAIISentiment) November 1, 2022
*Highest exposure to cash since March 2020
*Lowest equity exposure since May 2020
*Stock and stock fund allocations above historical average of of 61.5% for the 29th consecutive month.https://t.co/EiS0fTGmBh pic.twitter.com/kJ4OCmzrn2
How #hedgefunds are positioned in futures. $TNX $TYX $SPX $RUT $NDX $VIX $GLD $EUR $USD $WTI https://t.co/cgSr0uJ6Tu pic.twitter.com/ypC17QeVzE
— hedgopia (@hedgopia) November 5, 2022
As the tweets above demonstate, sentiment and positioning had gotten overly negative. Not a reason in itself for a rally but always a sign that if an argument can be made for a recovery then it could be swift and violent. This is exacly what happened once the CPI print was mild. A huge short covering move saw the Nasdaq surge over 7%. 4,083 is resistance from the 200-day moving average and is near September's high. That would neatly fill the gap up to 4,083 from Septmber 13.
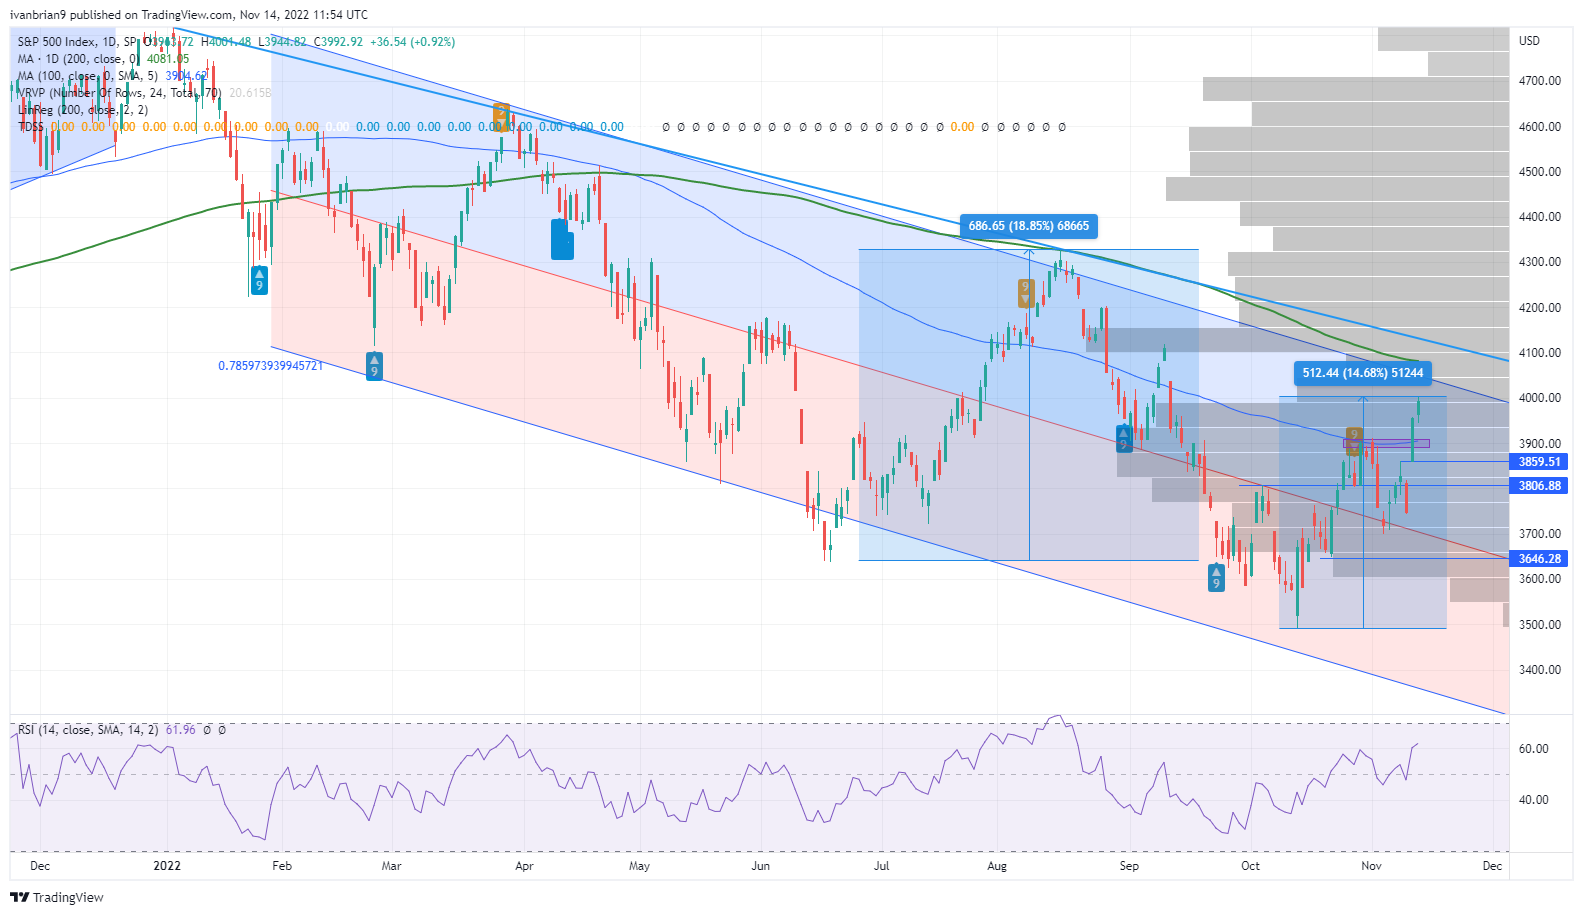
SPX daily chart
Premium
You have reached your limit of 3 free articles for this month.
Start your subscription and get access to all our original articles.
Author

Ivan Brian
FXStreet
Ivan Brian started his career with AIB Bank in corporate finance and then worked for seven years at Baxter. He started as a macro analyst before becoming Head of Research and then CFO.


