|

S&P 500 sheds 64 points on Tuesday to close -1.47% as risk appetite stumbles

  • US equities down across the board as risk aversion takes a bite out of stocks.
  • Deterioration in consumer sentiment and sliding new home sales is reigniting fears about the health of the US economy.
  • US equities indexes broadly down over a full percentage point for Tuesday.

The Standard & Poor's (S&P 500 equity index declined in Tuesday's market session, sliding 64 points to close at $4,273.53. The Dow Jones Industrial Average (DJIA) declined 388 points to end the day in the red 1.14% at $33,618.88. The NASDAQ composite index also shed almost 208 points, closing -1.57% into $13,063.61.

The DJIA saw its worst single-day decline since March while the S&P saw its lowest close since early June.

US new home sales broadly missed expectations, declining 8.7% from July.

US consumer confidence also declined, with the Conference Board Consumer Confidence Index printing 103 for September, a nearly six-point decline from August's 108.7. 

Backsliding economic health indicators for the US economy saw all eleven sectors in the S&P 500 close in the red for Tuesday.

September is on pace to reinforce its reputation as a poor month for equities: the S&P is down almost 7% for the month, while the DJIA and the NASDAQ are off the month's opening prices by 5% and 3% respectively.

With the Federal Reserve (Fed) seeing less rate cuts next year than markets initially hoping for, and Fed officials plaguing investors with hawkish comments that could see the Fed raising rates even more than markets have forecast, equities are swooning heading into the tail end of September.

Adding fuel to the short-side fire, the US is still facing down investor jitters as the US government barrels towards a potential government shutdown, and rumors of a potential bipartisan deal are doing little to quell the market rattles.

S&P 500 technical outlook

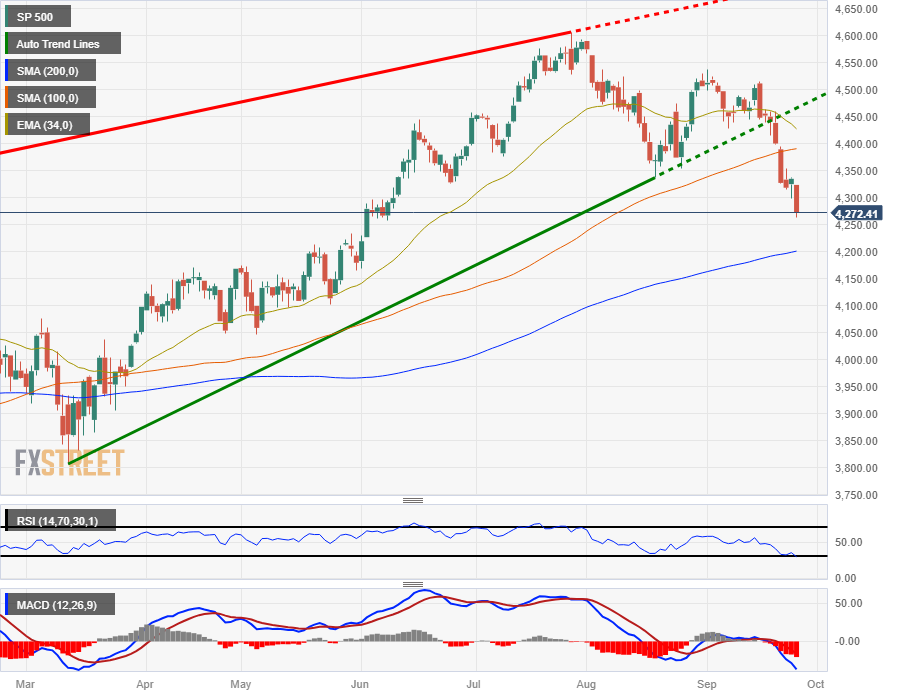
The S&P 500 is tumbling for Tuesday, sliding into $4,272.00 and well off last week's late swing high of $4,460.00 and is down 7.25% from late July's peak near $4,600.00.

Daily candlesticks see the S&P 500 skidding toward the 200-day Simple Moving Average (SMA) at the $4,200.00 handle, and there is little long-term technical support if equities continue to sell off.

The S&P 500's last meaningful bottom is priced in far below current price action near $3,800.00 from back in March.

S&P 500 daily chart

S&P 500 technical levels

SP 500

Overview
Today last price4272.41
Today Daily Change-62.85
Today Daily Change %-1.45
Today daily open4335.26
 
Trends
Daily SMA204452.76
Daily SMA504472.27
Daily SMA1004389.45
Daily SMA2004201.78
 
Levels
Previous Daily High4337.8
Previous Daily Low4298.17
Previous Weekly High4464.19
Previous Weekly Low4314.54
Previous Monthly High4590.64
Previous Monthly Low4337.34
Daily Fibonacci 38.2%4322.66
Daily Fibonacci 61.8%4313.31
Daily Pivot Point S14309.69
Daily Pivot Point S24284.11
Daily Pivot Point S34270.06
Daily Pivot Point R14349.32
Daily Pivot Point R24363.37
Daily Pivot Point R34388.95

Author

Joshua Gibson

Joshua joins the FXStreet team as an Economics and Finance double major from Vancouver Island University with twelve years' experience as an independent trader focusing on technical analysis.

More from Joshua Gibson
Share:

Markets move fast. We move first.

Orange Juice Newsletter brings you expert driven insights - not headlines. Every day on your inbox.

By subscribing you agree to our Terms and conditions.

Editor's Picks

EUR/USD bounces toward 1.1750 as US Dollar loses strength

EUR/USD returned to the 1.1750 price zone in the American session on Friday, despite falling Wall Street, which indicates risk aversion. Trading conditions remain thin following the New Year holiday and ahead of the weekend, with the focus shifting to US employment and European data scheduled for next week.

GBP/USD nears 1.3500, holds within familiar levels

After testing 1.3400 on the last day of 2025, GBP/USD managed to stage a rebound. Nevertheless, the pair finds it difficult to gather momentum and trades with modest intraday gains at around 1.3490 as market participants remain in holiday mood.

Gold trims intraday gains, approaches $4,300

Gold retreated sharply from the $4,400  area and trades flat for the day in the $4,320 price zone. Choppy trading conditions exacerbated the intraday decline, although XAU/USD bearish case is out of the picture, considering growing expectations for a dovish Fed and persistent geopolitical tensions.

Cardano gains early New Year momentum, bulls target falling wedge breakout

Cardano kicks off the New Year on a positive note and is extending gains, trading above $0.36 at the time of writing on Friday. Improving on-chain and derivatives data point to growing bullish interest, while the technical outlook keeps an upside breakout in focus.

Economic outlook 2026-2027 in advanced countries: Solidity test

After a year marked by global economic resilience and ending on a note of optimism, 2026 looks promising and could be a year of solid economic performance. In our baseline scenario, we expect most of the supportive factors at work in 2025 to continue to play a role in 2026.

Crypto market outlook for 2026

Year 2025 was volatile, as crypto often is.  Among positive catalysts were favourable regulatory changes in the U.S., rise of Digital Asset Treasuries (DAT), adoption of AI and tokenization of Real-World-Assets (RWA).