|

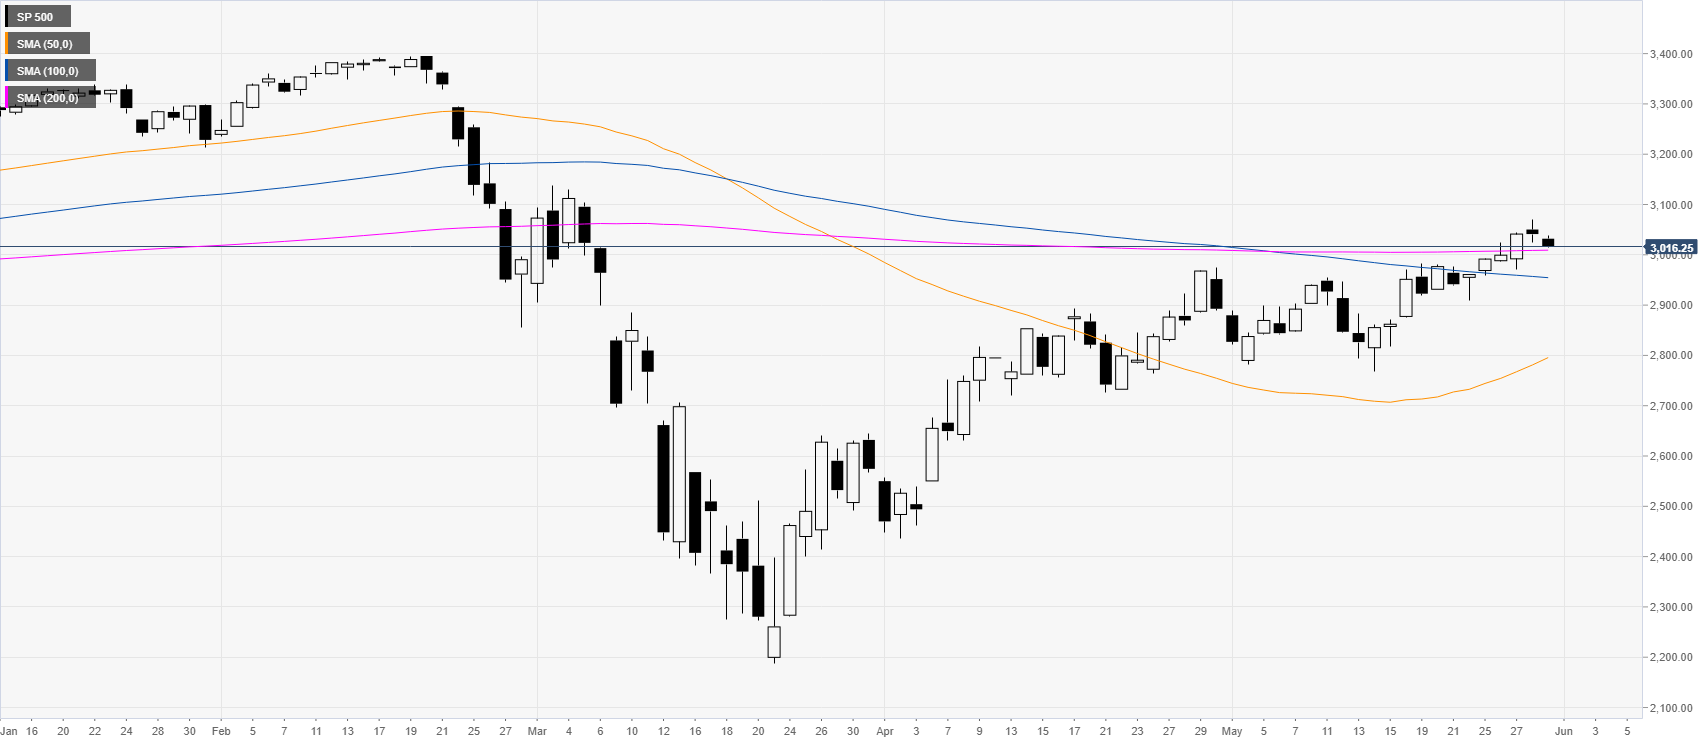
S&P 500 Price Analysis: US stocks advance taking a breather above 3000 mark

  • The bullish recovery is taking a breather above the 3000 mark.
  • Support can emerge near the 3000 and 2960 levels. 
 

S&P 500 daily chart

 
After the crash seen in February-March, the S&P 500 is rebounding up sharply while regaining most of the lost ground. The market is hovering in 2.5-month highs above its main SMA on the daily chart. The index broke beyond the 3000 key resistance which is seen as a bullish sign. As buyers stay firmly in control, the index is eyeing the 3075/3100 price area and the 3180 level in the medium-term. On the flip side, support can emerge the 3000, 2960 and 2900 levels initially.


Additional key levels

SP 500

Overview
Today last price3019.25
Today Daily Change-22.00
Today Daily Change %-0.72
Today daily open3041.25
 
Trends
Daily SMA202917.66
Daily SMA502780.98
Daily SMA1002956.99
Daily SMA2003008.73
 
Levels
Previous Daily High3069.5
Previous Daily Low3023.75
Previous Weekly High2982.5
Previous Weekly Low2874.5
Previous Monthly High2974
Previous Monthly Low2436.25
Daily Fibonacci 38.2%3041.23
Daily Fibonacci 61.8%3052.02
Daily Pivot Point S13020.17
Daily Pivot Point S22999.08
Daily Pivot Point S32974.42
Daily Pivot Point R13065.92
Daily Pivot Point R23090.58
Daily Pivot Point R33111.67

Author

Flavio Tosti

Flavio Tosti

Independent Analyst


More from Flavio Tosti
Share:

Editor's Picks

EUR/USD looks weak below 1.1800

EUR/USD has slipped back under pressure, breaking through the 1.1800 support and drifting towards the weekly lows near 1.1770 ahead of the opening bell in Asia. The move reflects renewed strength in the US Dollar, with steady geopolitical tensions keeping its demand firm. Moving forward, the release of the German labour market report and flash inflation figures should keep European investors entertained on Friday.
 

GBP/USD threatens the 200-day SMA near 1.3440

GBP/USD rapidly leaves behind Wednesday’s strong advance, coming under heavy pressure and retesting the 1.3440 zone, where the critical 200-day SMA is located. Cable’s deep pullback follows the strong gains in the Greenback, while investors continue to pencil in a potential BoE rate cut in March.

Gold trims gains, slips back to around $5,170

Gold is now facing some downside pressure, hovering around the $5,170 region on Thursday. The yellow metal surrenders part of its earlier gains on the back of the resurgence of the buying interest in the Greenback. In the meantime, geopolitical tensions in the Middle East continue to limit the downside potential for now.

How AI, blockchain, stablecoins are shaping a new global economy – Circle CEO Jeremy Allaire

Artificial Intelligence (AI), blockchain technology and stablecoins are emerging as core pillars of a new global economic system, according to Circle’s CEO, Jeremy Allaire.

Changing the game: International implications of recent tariff developments

The Supreme Court ruling on International Emergency Economic Powers Act (IEEPA) tariffs provides limited relief for the rest of the world, with weighted average tariff rates modestly lower.

Bitcoin steadies as traders eye US–Iran talks

Bitcoin (BTC) price is stabilizing around $68,000 at the time of writing on Thursday after a 6.2% relief rally the previous day amid a broader downward trend.