S&P 500 notches new all-time high despite rising inflation print
- S&P 500 marks new all-time high at 6,170.
- NASDAQ also garners new all-time high on Friday.
- Rising PCE inflation in May fails to distract investors.
- UBS raises year-end S&P 500 target to 6,200.

The S&P 500 has garnered a new all-time high on Friday, reaching 6,170 at the time of writing to overtake the February 19 high from four months ago. The index has risen slightly more than half a percentage point.
The victory comes despite the Federal Reserve's (Fed) favorite gauge of inflation — the core Personal Consumption Expenditures Price Index (PCE) — coming in higher than expected for May in the premarket. The annualized data ticked up 2.7%, a tenth of a percent higher than the April reading, which was also revised a tenth of a percent higher. In Congressional testimony earlier this week, Fed Chair Jerome Powell noted that the Trump administration's tariffs could spur inflation and halt the need for a near-term interest rate cut.
However, the CME Group's FedWatch Tool showed bets on a 25 bps cut at the September meeting only dropping from 74% to 72% after the inflation reading.
The NASDAQ Composite, up 0.5%, also reached a new all-time high at 20,273, while the Dow Jones Industrial Average has risen 0.7% but remains a few percentage points off its own all-time high.
Nike (NKE) stock has surged 14% on Friday after beating reduced analyst expectations for its fiscal fourth quarter and despite management expecting a $1 billion rise in costs due to the new tariff policies.
S&P 500 chart
The S&P 500 has overtaken the prior resistance barrier, ranging from roughly 6,100 to 6,150, and is now well above its Liberation Day crash levels. The Israel-Iran war in mid-June failed to cause much of a sell-off, but the ceasefire earlier this week has led to a major risk-on move.
The previous all-time high from February 19 at 6,147 is no longer a barrier.
The 50-day and 200-day Simple Moving Averages (SMAs) offer support all the way down at 5,800, which leads to the suggestion that the current momentum could carry the index far above the next target at 6,200.
If increasing inflation fails to halt the market's three-month rally, it's hard to say what will. More than a few analysts are pointing to the S&P 500 reaching 6,500 in the second half of the year. UBS raised its own year-end price target to 6,200 on Friday, however, which shows little upside from here.
With the White House finalizing its trade deal with China on Friday, as well as Commerce Secretary Howard Lutnick promising ten more trade deals will get finished before President Donald Trump's self-imposed July 9 deadline for tariffs, the market dynamic suggests that trade issues are now longer an issue for the stock market.
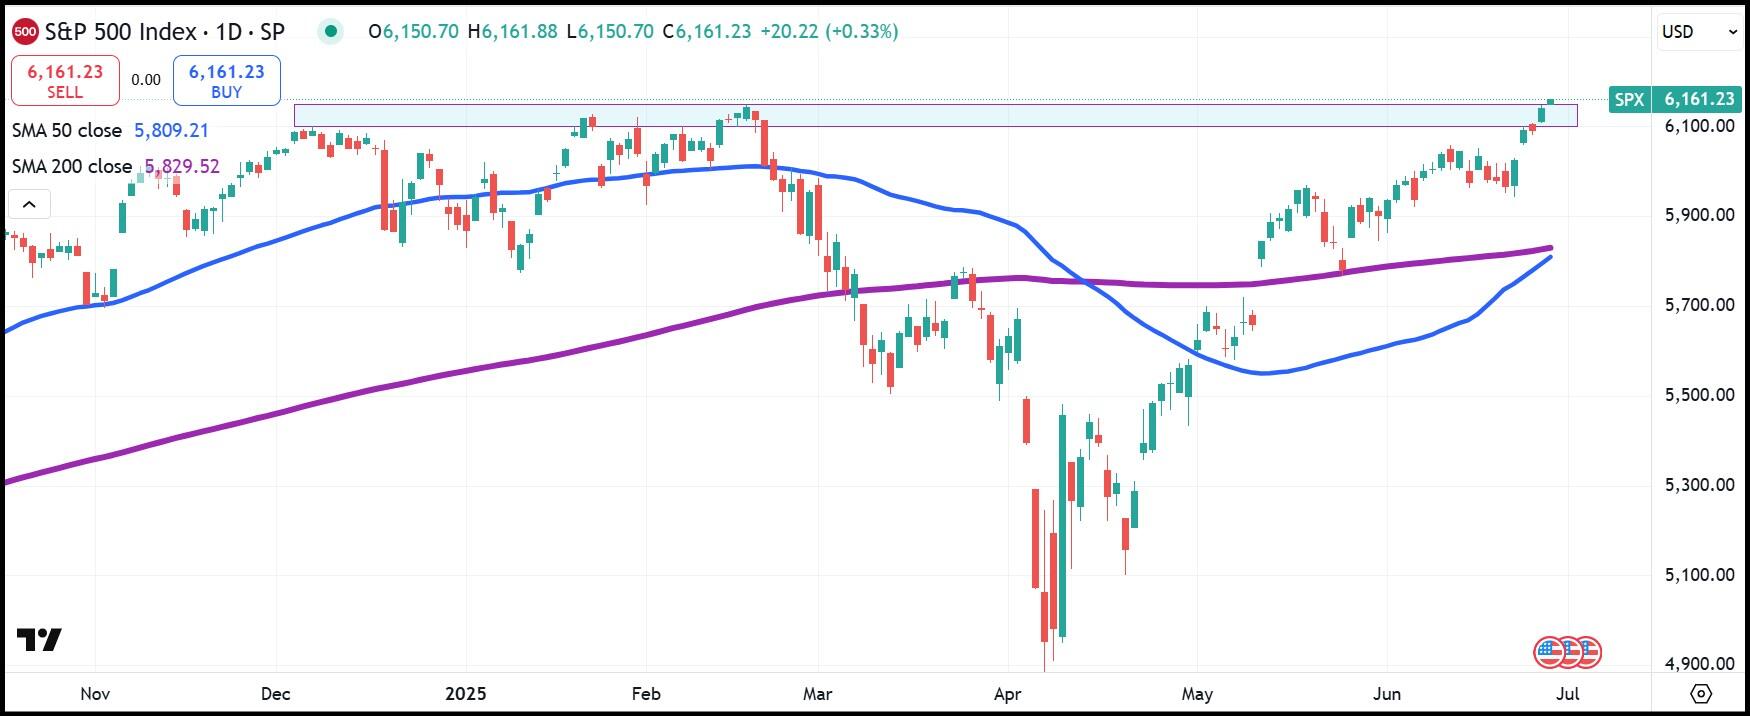
S&P 500 daily chart
Author

Clay Webster
FXStreet
Clay Webster grew up in the US outside Buffalo, New York and Lancaster, Pennsylvania. He began investing after college following the 2008 financial crisis.


