S&P 500 futures poised at critical 5,975–5,980 juncture: June 5 playbook

Break-and-hold above 5,980.75 unlocks a run toward 6,000–6,039; failure below 5,975.50 targets 5,944.50–5,876.50. To define bias, use VWAP and Volume Profile confluence on the 5-minute, H4, and Daily (6-month) charts.
1. Overview and context
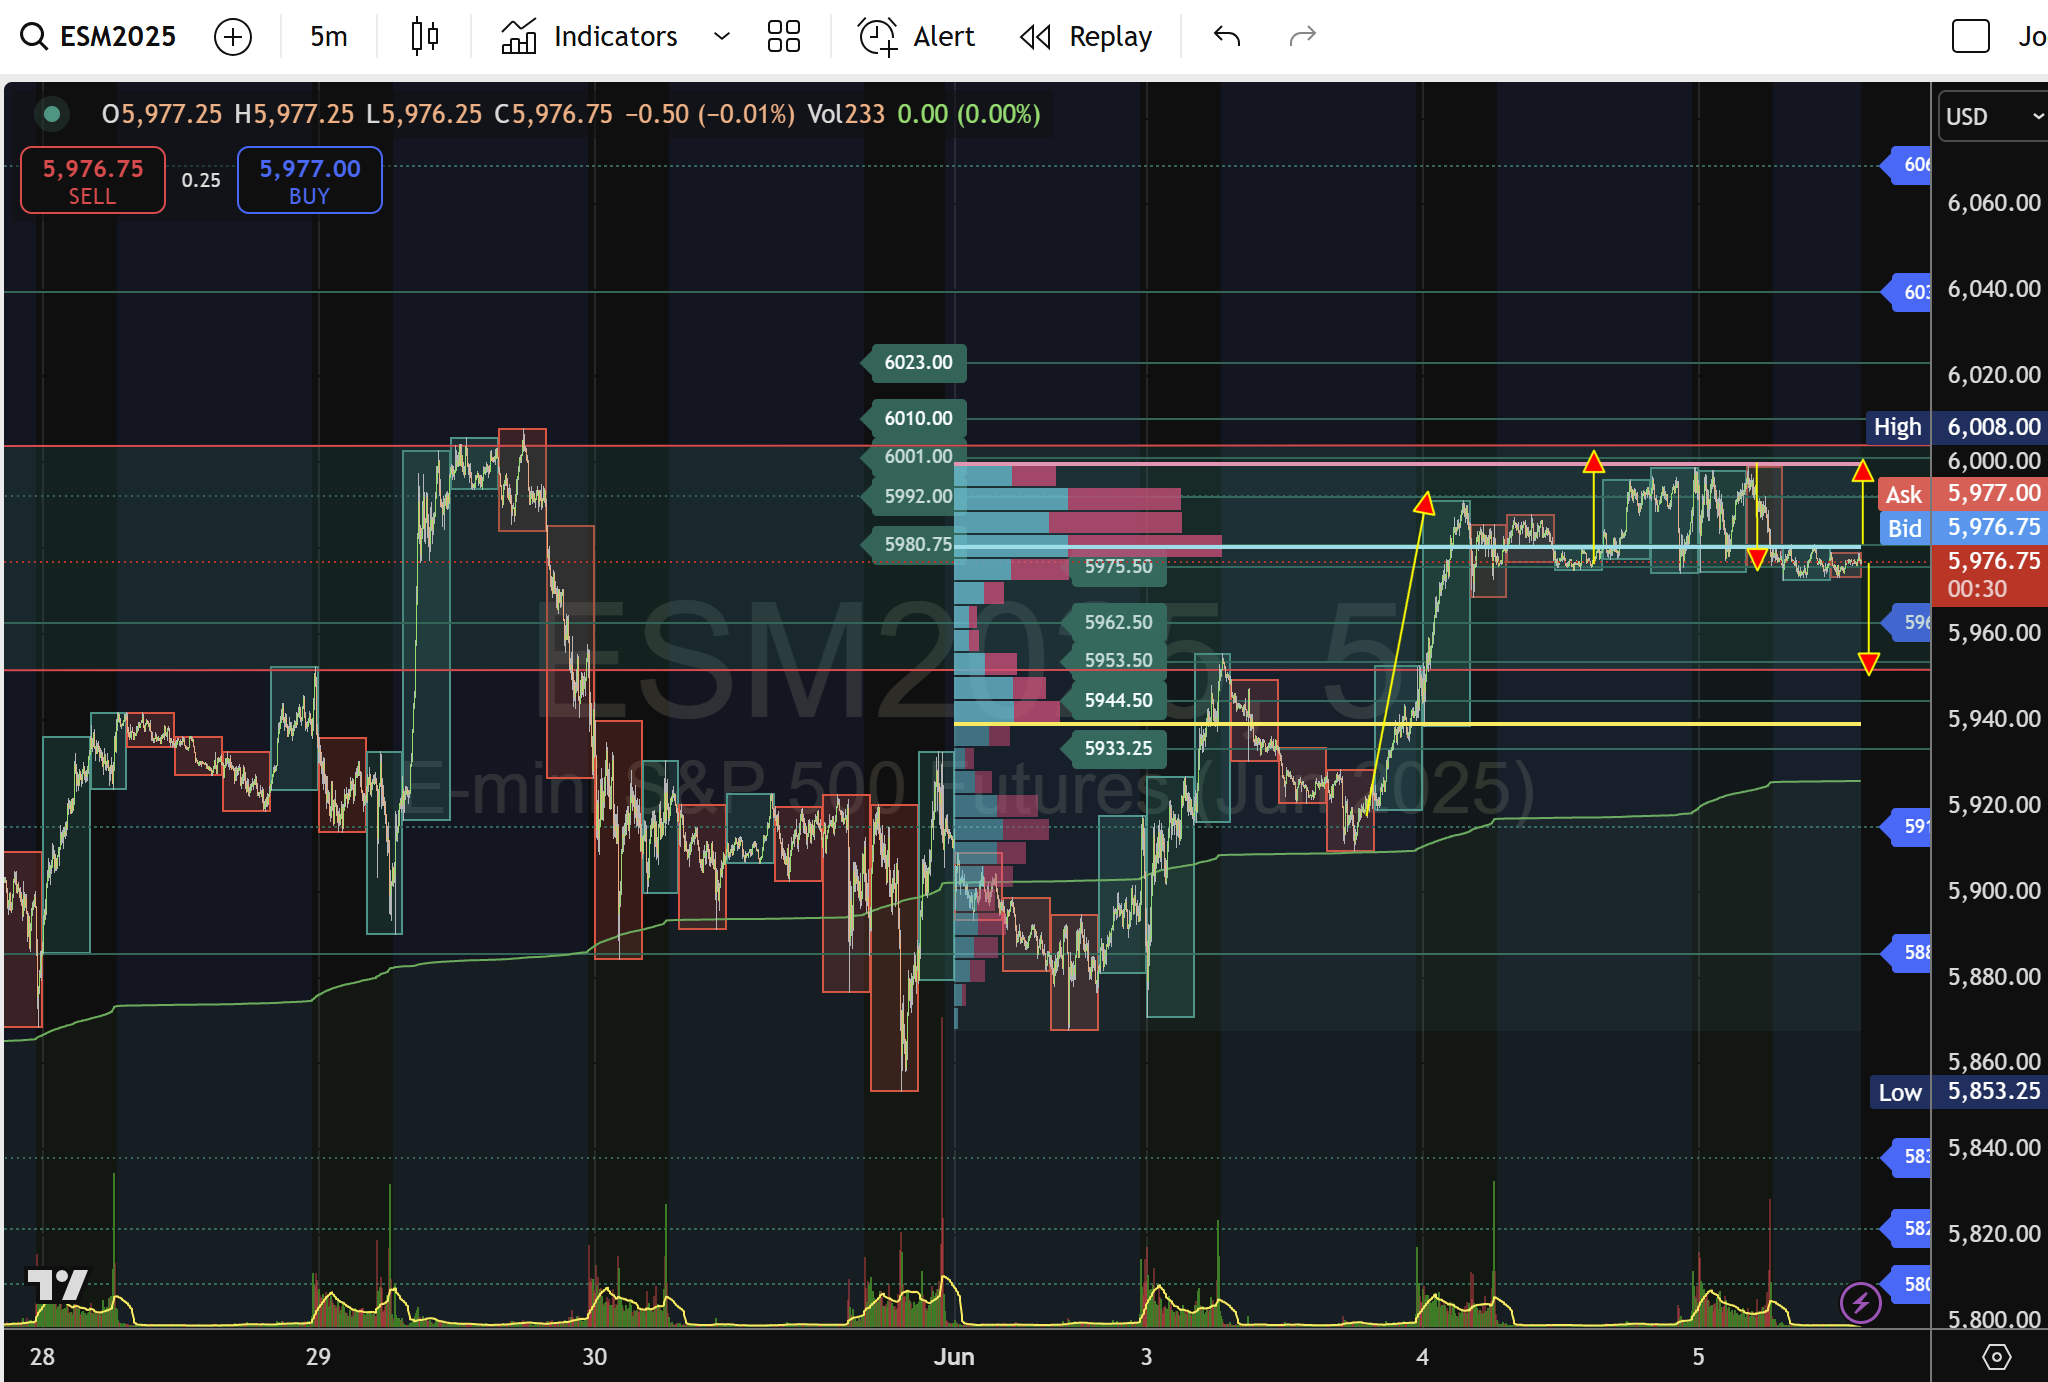
Since May 19, S&P 500 E-mini futures (ES M2) have been capped just below the 6,000 round number. Over the last two sessions, price repeatedly poked above 5,980.75 (the POC of the 5-minute session Volume Profile) but could not sustain momentum to close above 6,000. At the start of the June 5 London/New York overlap, ES oscillates between 5,980.75 (light-blue POC) and 5,975.50 (lower edge of the 5-minute value area). This narrow range—5,975.50–5,980.75—will likely define the direction for the remainder of Thursday’s session.
-
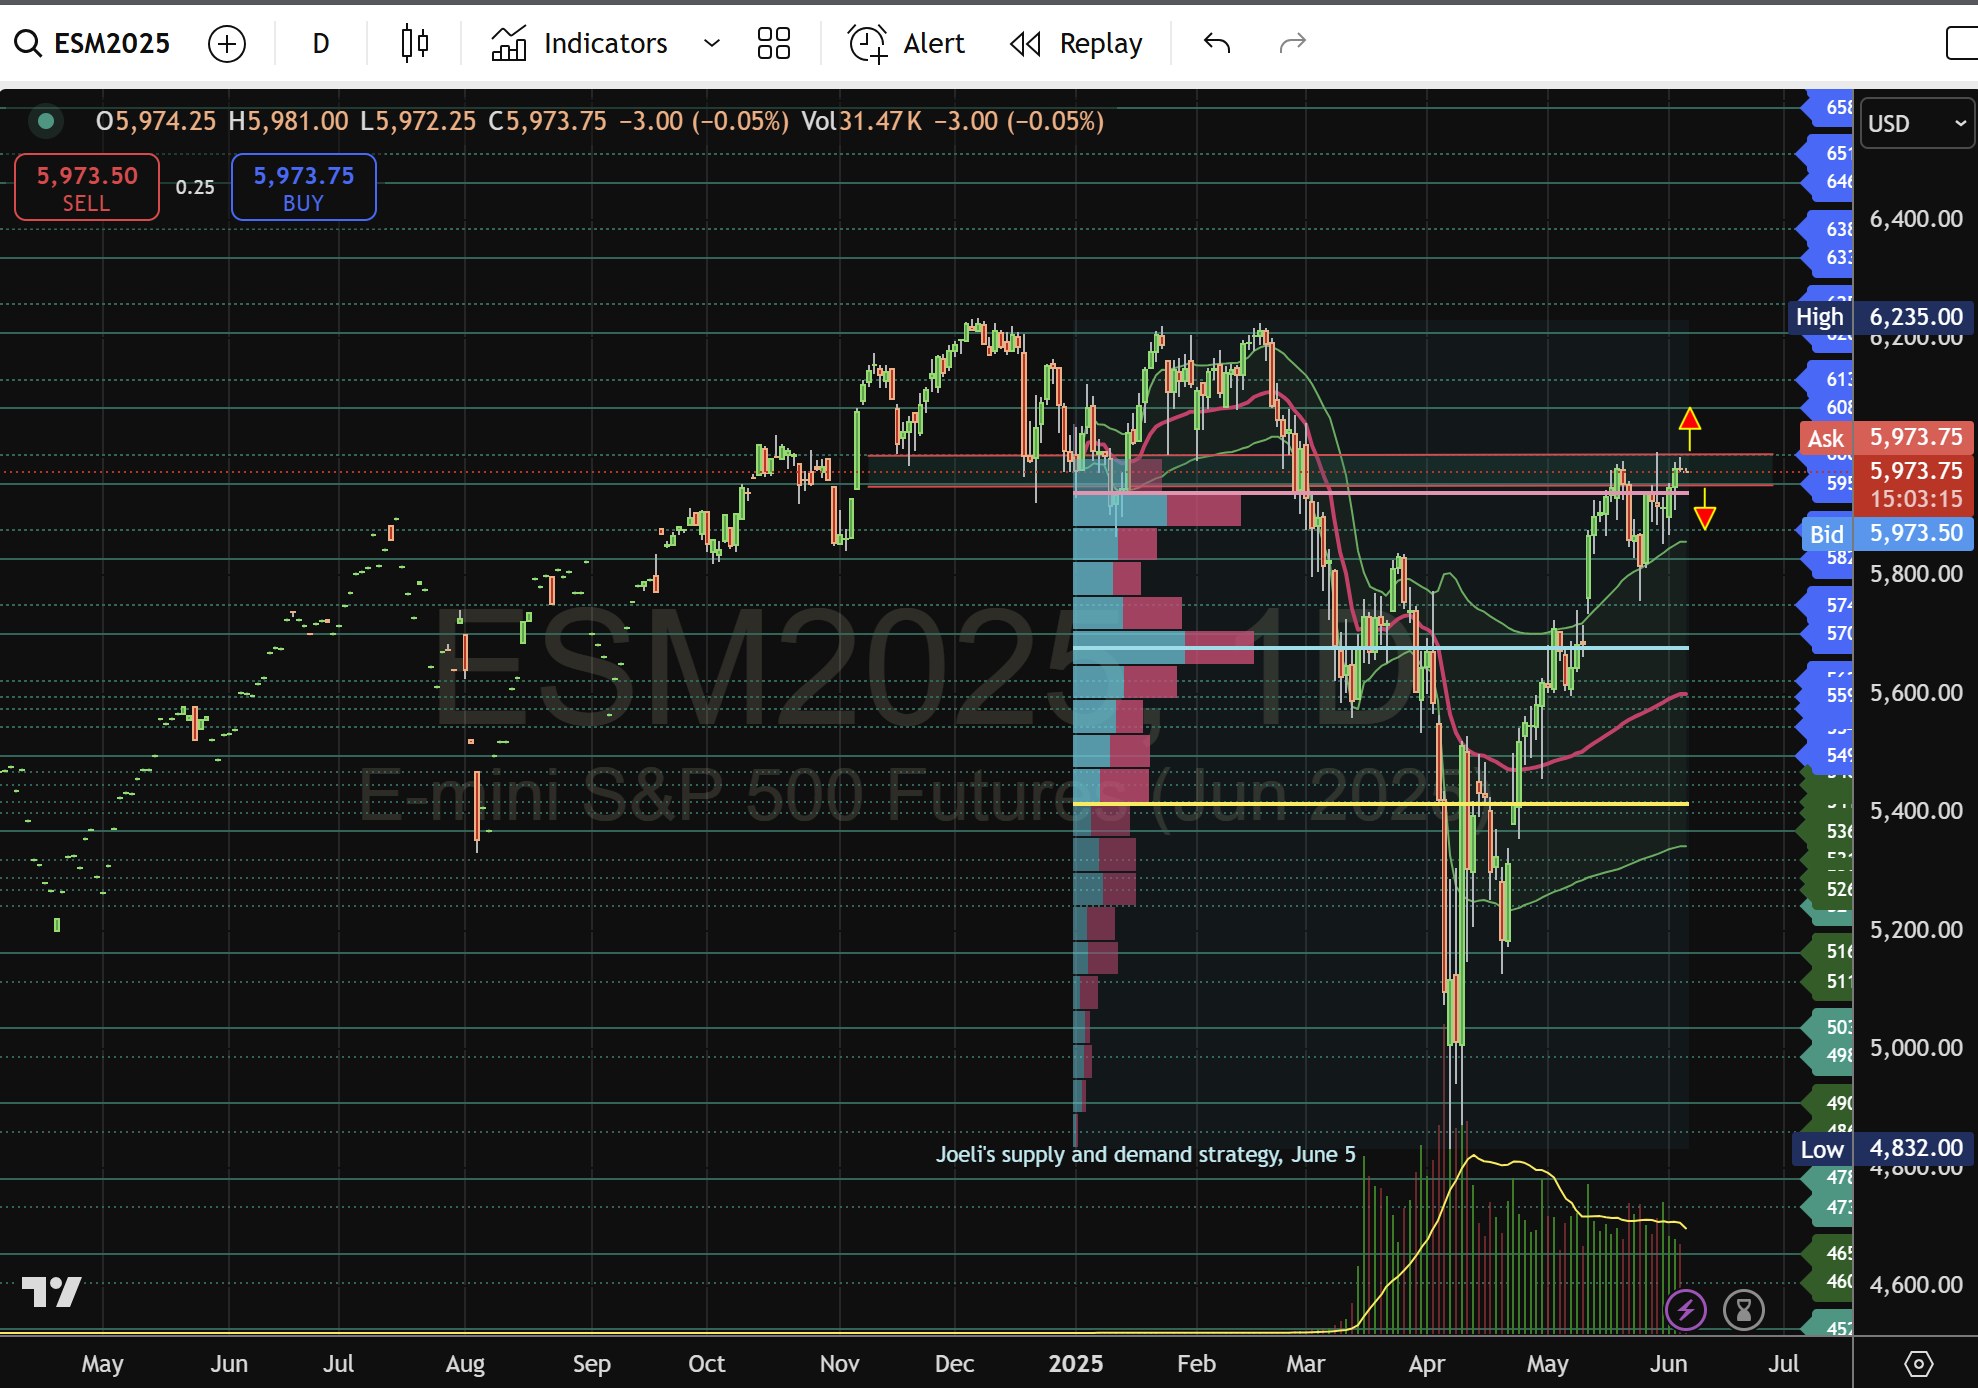
Daily chart (6-month VP & VWAP):
-
Resistance: 6,000 (psychological ceiling), then 6,081–6,130 (distribution node).
-
Support: 5,954–5,944.50 (last 5-min POC aligns with daily VWAP), then 5,876 (daily VPOC), 5,827 (daily VAH/VAL).
-
-
Four-hour chart (Weekly VP & VWAP):
-
Resistance: 5,992–6,001 (weekly profile high-volume node).
-
Support: 5,915 (weekly VWAP), 5,885.50 (H4 value low), then 5,853.25 (weekly profile low).
-
-
5-Minute chart (Session VP & VWAP):
-
Upper POC: 5,980.75 (dotted light-blue).
-
Lower value edge: 5,975.50 (dotted teal).
-
VWAP (5-min): Currently rising, sitting near 5,962.50, offering dynamic mid-range support.
-
2. Key levels to watch (All times in ES price points)
-
Immediate range
-
Resistance (5-min POC): 5,980.75
-
Support (5-min VAL): 5,975.50
-
-
Bullish targets
-
First Trigger: Close & hold above 5,980.75 – 5,981.00
-
Next: 5,992.00 (H4 VP high density), then 6,000.00 (round number).
-
Secondary: 6,010.00–6,023.00 (H4 value area and VP node).
-
Extended: 6,039.50 (daily VP edge), 6,069.00 (daily VWAP extension).
-
-
Bearish targets
-
First Trigger: Break & hold below 5,975.50
-
Next: 5,962.50 (rising 5-min VWAP, confluence H4/VWAP).
-
Secondary: 5,953.50 (5-min POC level, H4 mid-value area).
-
Tertiary: 5,944.50 (5-min VAL, daily VWAP confluence).
-
Danger Zone: 5,876.00 (daily VPOC), 5,827.50 (daily VAL).
-
-
Structural support (Daily)
-
If ES loses 5,944.50, sellers may extend to 5,876.00–5,827.50.
-
Weekly VWAP at 5,915.00 and H4 VAH at 5,885.50 provide intermediate bids.
-
3. Trading scenarios and playbook
3-1 Bullish scenario (Long bias)
-
Entry:
-
Aggressive: Enter long on a 1–2-tick close above 5,980.75 on 5-minute bars (confirm with rising 5-min VWAP).
-
Conservative: Wait for 6,000.00 to be taken out intra-day (a daily chart candle close above 6,000 adds conviction).
-
-
Initial stop:
-
Beneath the 5-min value area low at 5,975.50 (1-point buffer).
-
Alternatively under the 5-min VWAP at 5,962.50 if riding a larger impulse.
-
-
Profit targets:
-
Target 1: 5,992.00 (H4 high-volume node).
-
Target 2: 6,000.00 (psychological pivot).
-
Target 3: 6,010.00–6,023.00 (cluster on H4/daily VP).
-
-
Trail & manage:
-
Once 6,000 is taken, trail stop to breakeven or just below 5,980.75.
-
If momentum continues, move stop to just below 5,992.00 for partials; hold remainder toward 6,023.00.
-
3-2 Bearish scenario (short bias)
- Entry:
-
Aggressive: Short on break-and-hold below 5,975.50 on 5-min bars (confirm with 5-min VWAP slope flattening/falling).
-
Conservative: Wait for a retest of 5,980.75 after an intra-day failure to reclaim it, short on rejection.
-
-
Initial stop:
-
Just above 5,980.75 (1–2 ticks above POC).
-
Alternatively, above 5,992.00 if using a deeper pullback entry.
-
-
Profit targets:
-
Target 1: 5,962.50 (rising 5-min VWAP + H4 VWAP confluence)
-
Target 2: 5,953.50 (5-min POC & H4 mid-value).
-
Target 3: 5,944.50 (5-min VAL & daily VWAP).
-
Extended: 5,876.00 (daily VPOC), 5,827.50 (daily VAL).
-
-
Trail & manage:
-
After 5,962.50 is taken, move stop to breakeven or just above 5,975.50.
-
Once 5,953.50 prints, tighten to just above 5,962.50 for the remaining contracts.
-
4. Multi-timeframe confluence
-
5-minute chart (Session VP & VWAP):
-
The 5-min Volume Profile shows a sharp value area between 5,975.50 and 5,980.75.
-
VWAP on 5-min is rising and currently around 5,962.50—any sustained trade above this line supports a bullish tilt.
-
Observe whether volume clusters above POC or below VAL; breakout volume is key.
-
-
Four-hour chart (weekly VP & VWAP):
-
Weekly VWAP (~5,915.00) lies well below current price—bulls remain in control as long as ES stays above 5,915.
-
The H4 Volume Profile shows a major node at 5,992.00 and a support node around 5,885.50–5,915.00.
-
Use H4 VWAP slope: still gently rising, so lean long above 5,915; strong H4 support at 5,885.50 if price reaches there.
-
-
Daily chart (6-month VP & VWAP):
-
Daily VWAP (6-month) sits near 5,954.00–5,944.50 zone—confluent with 5-min support at 5,944.50.
-
A close below 5,944.50 would signal a loss of the mid-term uptrend and likely accelerate toward 5,876.00–5,827.50.
-
Bulls need to reclaim and close daily above 6,000 to keep the six-month trend intact (higher highs).
-
5. Risk management and execution tips
-
Position sizing: Given the ES tick value ($12.50 per 0-25), risking 10 ticks (~$125) per contract on a 5-min POC break gives room for price noise but keeps risk reasonable. Adjust size if tighter stops (e.g., 5 ticks).
-
Volume confirmation: Never enter purely on level touch—look for increased volume at breakout of 5,980.75 or breakdown of 5,975.50.
-
Time-of-day considerations:
-
The London/New York overlap (08:00–11:00 ET) tends to see higher liquidity—ideal for playing breakout/breakdown of the 5-min POC.
-
Be cautious after 09:30 ET; price may chop once US session fully opens if no clear catalyst.
-
6. Sample intra-day trade execution (long)
-
8:15 ET: ES tests 5,980.75 on 5-min, prints a 5-min close at 5,980.75 with above-average volume.
-
Entry (8:20 ET): Go long 1 contract at 5,981.00.
-
Stop: Place stop at 5,975.25 (just under 5,975.50). (Risk = 5-75 points ~ $287.50.)
-
First target: 5,992.00 — partially scale out half at that level.
-
Trail: Move stop to breakeven once 6,000 prints. Hold remaining contract to 6,010–6,023.
(This analysis is for informational purposes only and does not constitute trading advice. Always perform your due diligence and consult your financial advisor before making trading decisions.)
Author

Denis Joeli Fatiaki
Independent Analyst
Denis Joeli Fatiaki possesses over a decade of extensive experience as a multi-asset trader and Market Strategist.


