S&P 500 ends modest Monday trading as markets reflect ahead of Fed


  • US equities take a minute to digest, spreading into the middle for Monday.
  • S&P 500, DJIA, and NASDAQ all post slim gains for Monday as markets go quiet.
  • Fed rate call promises plenty of action for the mid-week.

The Standard & Poor’s (S&P) 500 US equity index wrapped up Monday markets barely changed on the day, near $4,453.00 as US equities take a breather before the Federal Reserve (Fed) drops their latest rate call on Wednesday.

Fed to bring rate call, economic projections in the mid-week

The S&P saw thin trading for Monday as investors gear up for the latest showing from the Fed and its Federal Open Market Committee, which is expected to hold rates steady at the next meeting slated for Wednesday.

The US central bank is set to stand pat on interest rates, and investors will be paying close attention to the FOMC press conference to follow the rate call, looking for any hints about the path forward on the rate hike cycle.

The FOMC will also be releasing their updated inflation expectations for the US economy alongside the Fed’s latest monetary policy statement.

American equities spread their bets on Monday, with the S&P 500, Dow Jones Industrial Average (DJIA), and NASDAQ Composite indexes all wrapping up the day near where they started. The S&P finished the big winner, gaining a scant 0.07% during market hours.

The DJIA and the NASDAQ competed in a slow race, with the indexes closing +0.02% and 0.01% respectively. The DJIA heads into the overnight session trading into $34,625.00 while the NASDAQ sits just above $13,710.00.

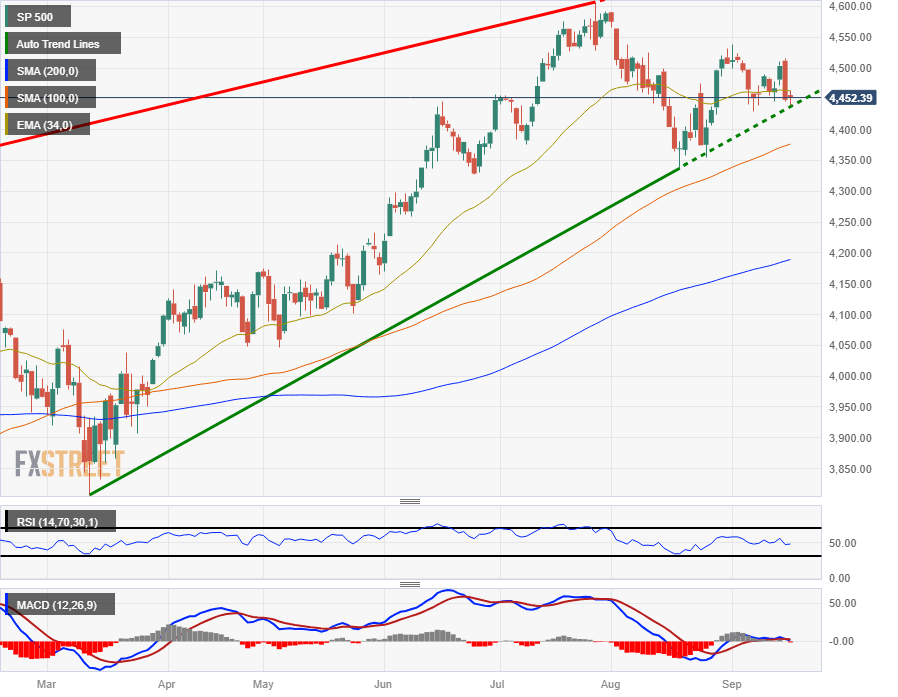
S&P 500 technical outlook

The S&P 500 is tipping into support from the rising trendline baked in from March’s lows near $3,800.00, and continued downside will see support from the 100-day Simple Moving Average (SMA) at $4,376.00. 

The 200-day SMA sits well below price action near $4,190.00, and market prices are being constrained by a sideways 34-day Exponential Moving Average (EMA), and a lack of meaningful directional momentum is seeing technical indicators drift into their midpoints.

Current chart patterns see a floor from the last swing low eat $4,350.00 and the ceiling marked in from September’s high point near $4,540.00.

S&P 500 daily chart

S&P 500 technical levels

SP 500

Overview
Today last price 4452.39
Today Daily Change 4.06
Today Daily Change % 0.09
Today daily open 4448.33
 
Trends
Daily SMA20 4460.42
Daily SMA50 4483.69
Daily SMA100 4373.67
Daily SMA200 4188.2
 
Levels
Previous Daily High 4514.93
Previous Daily Low 4446
Previous Weekly High 4514.93
Previous Weekly Low 4445.7
Previous Monthly High 4590.64
Previous Monthly Low 4337.34
Daily Fibonacci 38.2% 4472.33
Daily Fibonacci 61.8% 4488.6
Daily Pivot Point S1 4424.58
Daily Pivot Point S2 4400.82
Daily Pivot Point S3 4355.65
Daily Pivot Point R1 4493.51
Daily Pivot Point R2 4538.68
Daily Pivot Point R3 4562.44


Share: Feed news

Information on these pages contains forward-looking statements that involve risks and uncertainties. Markets and instruments profiled on this page are for informational purposes only and should not in any way come across as a recommendation to buy or sell in these assets. You should do your own thorough research before making any investment decisions. FXStreet does not in any way guarantee that this information is free from mistakes, errors, or material misstatements. It also does not guarantee that this information is of a timely nature. Investing in Open Markets involves a great deal of risk, including the loss of all or a portion of your investment, as well as emotional distress. All risks, losses and costs associated with investing, including total loss of principal, are your responsibility. The views and opinions expressed in this article are those of the authors and do not necessarily reflect the official policy or position of FXStreet nor its advertisers. The author will not be held responsible for information that is found at the end of links posted on this page.

If not otherwise explicitly mentioned in the body of the article, at the time of writing, the author has no position in any stock mentioned in this article and no business relationship with any company mentioned. The author has not received compensation for writing this article, other than from FXStreet.

FXStreet and the author do not provide personalized recommendations. The author makes no representations as to the accuracy, completeness, or suitability of this information. FXStreet and the author will not be liable for any errors, omissions or any losses, injuries or damages arising from this information and its display or use. Errors and omissions excepted.

The author and FXStreet are not registered investment advisors and nothing in this article is intended to be investment advice.

Recommended content


Recommended content

Editors’ Picks

AUD/USD faces formidable resistance around 0.6600

AUD/USD faces formidable resistance around 0.6600

AUD/USD resumed its weekly pullback on Thursday, this time accelerating its losses to the 0.6450 region on the back of the stronger US Dollar, while disheartening prints from the Australian labour market also contributed to the sour mood around the Aussie.

EUR/USD: Losses could pick up pace below 1.1470

EUR/USD: Losses could pick up pace below 1.1470

EUR/USD remained on the back foot and slipped back to fresh multi-week lows near 1.1550 on Thursday, always in response to the improved sentiment surrounding the Greenback, which in turn extended its upside momentum on the back of firmer data from key fundamentals.

Gold trades with modest losses near $3,340

Gold trades with modest losses near $3,340

Gold remains in auto-pilot around the $3,340 zone per troy ounce as the NA session draws to a close on Thursday. The yellow metal's negative trend stems from the extra improvement in the dollar, rising US yields, and some relief from trade concerns.

XRP price just 5% from record high as Ripple eyes Dubai's tokenized real estate market

XRP price just 5% from record high as Ripple eyes Dubai's tokenized real estate market

Ripple's (XRP) uptrend paces toward new all-time highs, but is trading at around $3.25 on Thursday, after a remarkable recovery from a support level tested at $2.80 on Tuesday.

China’s first-half growth remains on track, though activity data signals caution

China’s first-half growth remains on track, though activity data signals caution

China's second-quarter GDP beat forecasts again with a 5.2% year-on-year growth, driven by strong trade and industrial production. Yet sharper-than-expected slowdowns in fixed-asset investment and retail sales and falling property prices are a concern.

Best Brokers for EUR/USD Trading

Best Brokers for EUR/USD Trading

SPONSORED Discover the top brokers for trading EUR/USD in 2025. Our list features brokers with competitive spreads, fast execution, and powerful platforms. Whether you're a beginner or an expert, find the right partner to navigate the dynamic Forex market.

Forex MAJORS

Cryptocurrencies

Signatures

Best Brokers of 2025