|

S&P 500 E Mini (ES_F) perfect reaction higher from blue box area

In this technical blog, we will look at the past performance of the 1-hour Elliott Wave Charts of S&P 500 E Mini ES_F. We presented to members at the elliottwave-forecast. In which, the rally from the 31 May 2024 low unfolded as an impulse structure and showed a green right side tag. Suggested that the index should see more upside extension to complete the impulse sequence. Therefore, we advised members not to sell the index & buy the dips in 3, 7, or 11 swings at the blue box areas. We will explain the structure & forecast below:

S&P 500 E Mini ES_F One-hour Elliott Wave chart from 7.01.2024

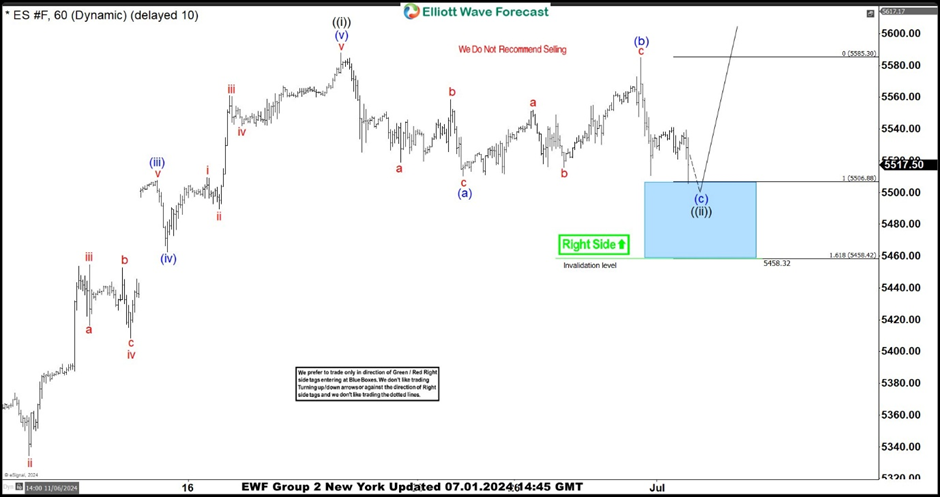
Here’s the 1-hour Elliott wave chart from the 7.01.2024 New York update. In which, the short-term cycle from the 5.31.2024 low ended in wave ((i)) as impulse at $5588 high. Down from there, the index made a pullback in wave ((ii)) to correct that cycle. The internals of that pullback unfolded as Elliott wave flat structure where wave (a) ended at $5510.25 low. Wave (b) bounce ended at $5585 high and wave (c) managed to reach the blue box area at $5506.88- $5458.42. From there, buyers were expected to appear looking for the next leg higher or for a 3 wave bounce minimum.

S&P 500 E Mini ES_F latest one-hour Elliott Wave chart from 7.09.2024

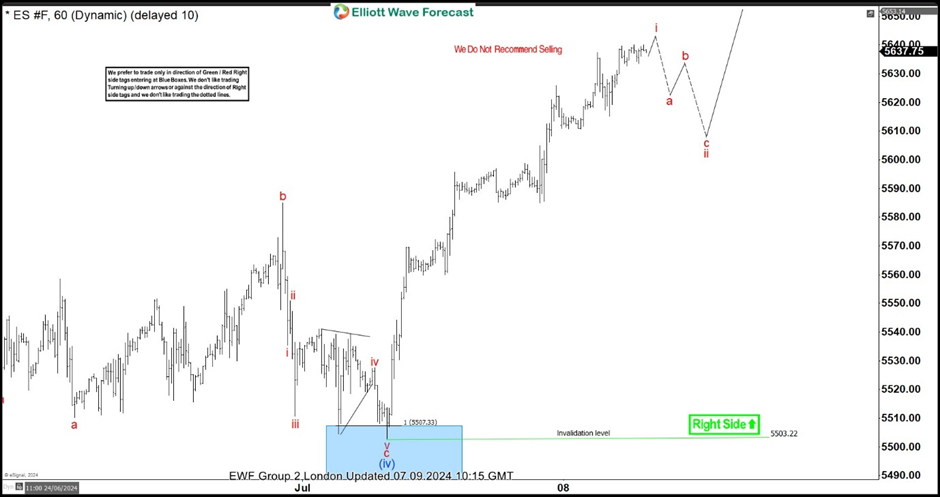
This is the latest 1-hour Elliott wave Chart from the 7.09.2024 London update. In which the index is showing a reaction higher taking place, right after ending the flat correction within the blue box area. Allowed members to create a risk-free position shortly after taking the long position at the blue box area. Since then the index has already made a new high above the previous peak confirming the next extension higher. However, it’s important to note that with further data we have adjusted the count slightly into a lesser degree.

Author

Elliott Wave Forecast Team

Elliott Wave Forecast Team

ElliottWave-Forecast.com

More from Elliott Wave Forecast Team
Share:

Editor's Picks

EUR/USD accelerates losses, focus is on 1.1800

EUR/USD’s selling pressure is gathering pace now, opening the door to a potential test of the key 1.1800 region sooner rather than later. The pair’s pullback comes on the back of marked gains in the US Dollar following US data releases and the publication of the FOMC Minutes later in the day.

GBP/USD turns negative near 1.3540

GBP/USD reverses its initial upside momentum and is now adding to previous declines, revisiting at the same time the 1.3540 region on Wednesday. Cable’s downtick comes on the back of decent gains in the Greenback and easing UK inflation figures, which seem to have reinforced the case for a BoE rate cut in March.

Gold picks pace, flirts with $5,000

Gold is back on the front foot on Wednesday, shaking off part of the early week softness and pushing higher towards the key $5,000 mark per troy ounce. The move comes ahead of the FOMC Minutes and is unfolding despite an intense rebound in the US Dollar.

Fed Minutes to shed light on January hold decision amid hawkish rate outlook

The Minutes of the Fed’s January 27-28 monetary policy meeting will be published today. Details of discussions on the decision to leave the policy rate unchanged will be scrutinized by investors.

Mixed UK inflation data no gamechanger for the Bank of England

Food inflation plunged in January, but service sector price pressure is proving stickier. We continue to expect Bank of England rate cuts in March and June. The latest UK inflation read is a mixed bag for the Bank of England, but we doubt it drastically changes the odds of a March rate cut.

Sui extends sideways action ahead of Grayscale’s GSUI ETF launch

Sui is extending its downtrend for the second consecutive day, trading at 0.95 at the time of writing on Wednesday. The Layer-1 token is down over 16% in February and approximately 34% from the start of the year, aligning with the overall bearish sentiment across the crypto market.