S&P 500 breadth: The quiet signal that trend is still healthy

The market continues to push higher, but the more important story is not speed. It is participation and structure. While price sits near all-time highs, underlying breadth suggests the trend remains intact rather than stretched or narrowly supported.
Constituents above the 200-day moving average: The quiet signal
The most telling input right now is not momentum, it is how many stocks remain structurally supported.
As of early January, more than 54 percent of S&P 500 constituents are trading above their 200-day moving average. That is a meaningful shift, because that is the first time in over 200 trading days.
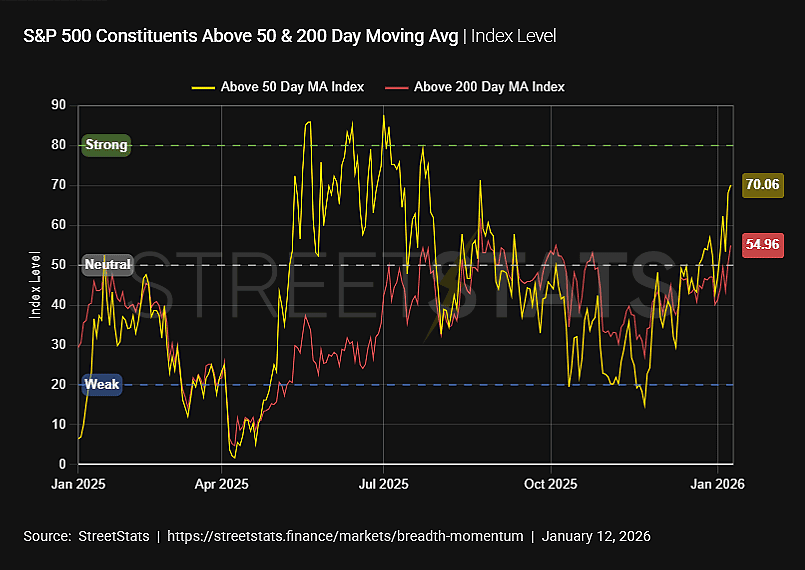
The 200-day MA is not a short-term trigger. It is a long-term trend filter. When a majority of stocks reclaim and hold above it, the market is no longer relying on a small leadership group to stay elevated.
S&P 500 remains within a solid price channel
On price, the S&P 500 Index remains within a well-defined rising channel anchored from the post-correction higher low late last year. The structure has remained disciplined.
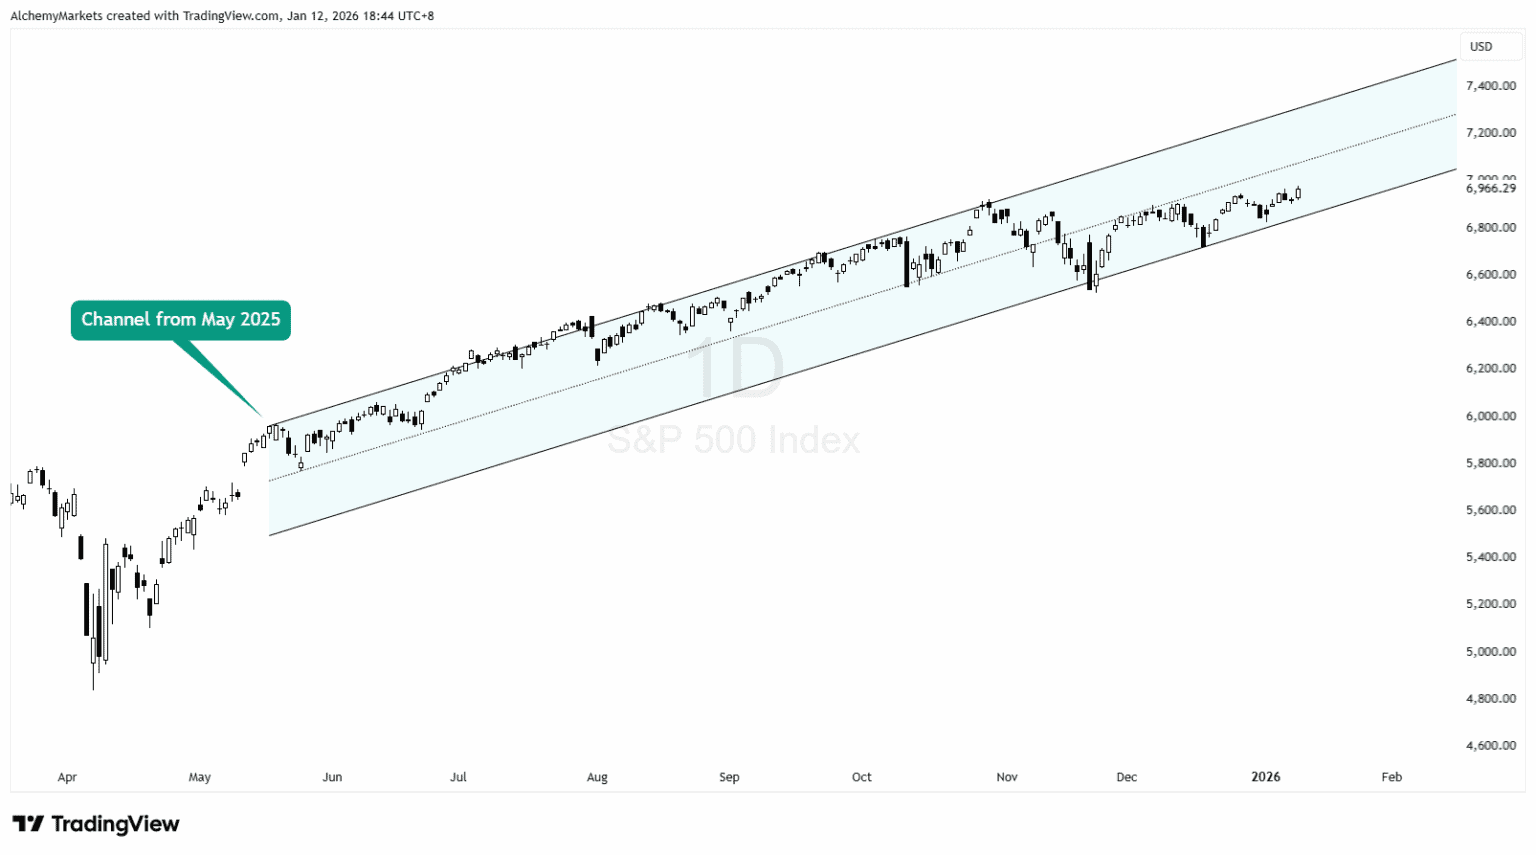
The midline has been respected repeatedly, acting as a reload zone rather than a failure point. Pullbacks into that area have consistently attracted buyers, keeping the broader trend intact.
This keeps the channel as the primary signal. Price is advancing in steps, not slipping into a parabolic or unstable phase.
Psychological levels and targets
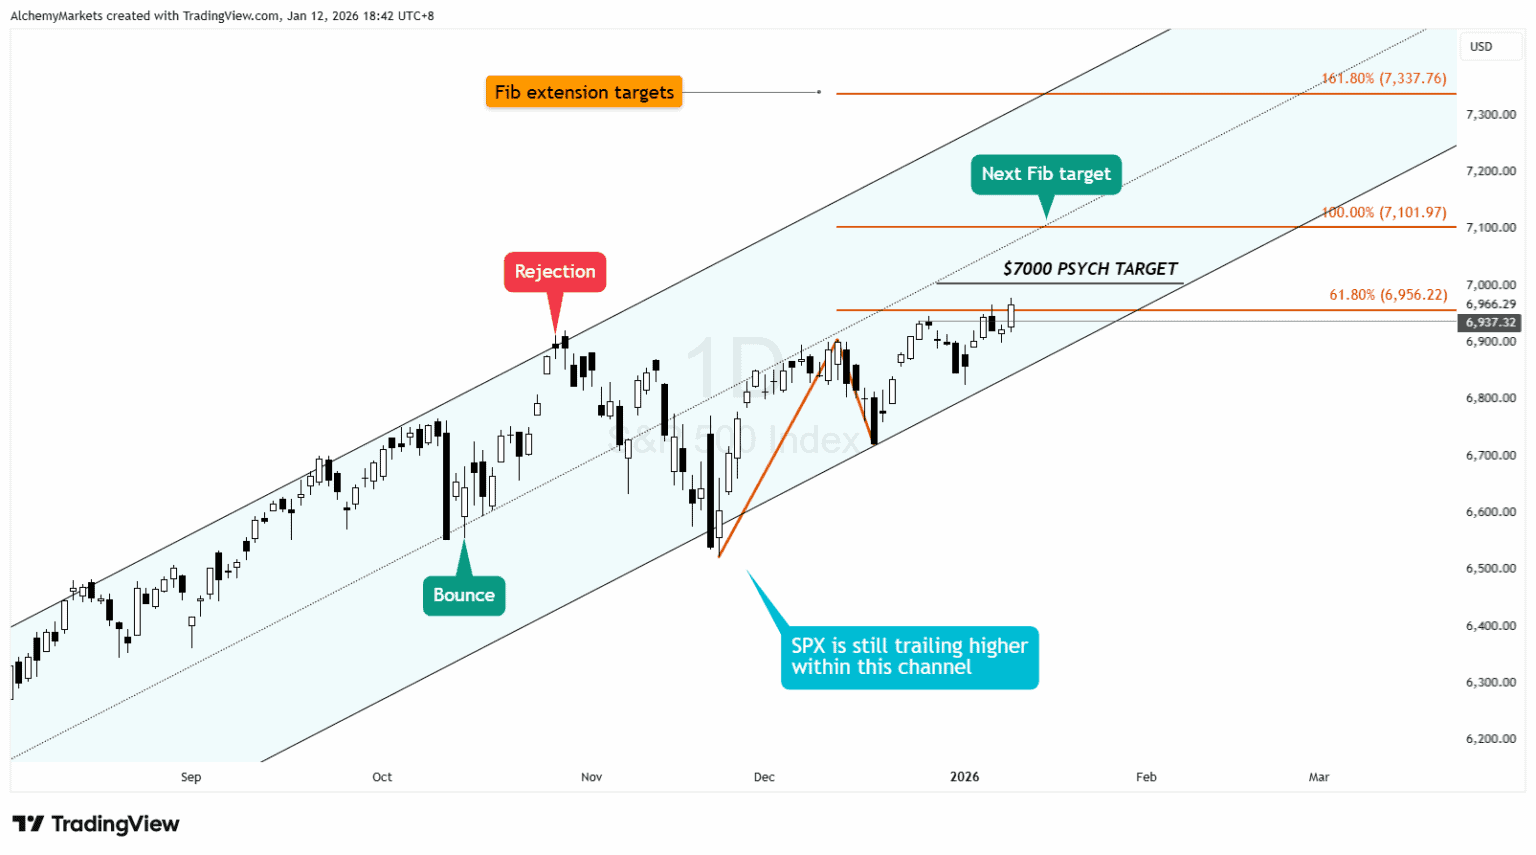
Market attention is fixed on $7,000, a heavily watched psychological level.
Levels like this rarely behave cleanly. They either invite short-term reactions or get overshot as momentum and systematic flows push through.
If 7,000 is cleared and price accepts above it, the next technically relevant area is the $7,100s, which aligns with the midline of the channel and also is the 100% target of the Fib extension tool.
Macro backdrop and volatility
Upcoming macro releases, particularly CPI, can inject short-term volatility and test conviction. Still, at all-time highs, liquidity expectations and systematic positioning often dominate near-term price action.
It is a familiar setup. Markets can remain irrational longer than traders expect, especially when trend structure and participation are aligned.
Bottom line
More stocks are back above their 200-day moving averages, short-term participation is improving, and price continues to respect its rising channel. Until the channel breaks decisively or participation rolls over, the trend remains healthy, even as price pushes into levels that feel crowded.
Author

Zorrays Junaid
Alchemy Markets
Zorrays Junaid has extensive combined experience in the financial markets as a portfolio manager and trading coach. More recently, he is an Analyst with Alchemy Markets, and has contributed to DailyFX and Elliott Wave Forecast in the past.


