|

S&P 500 and market breadth

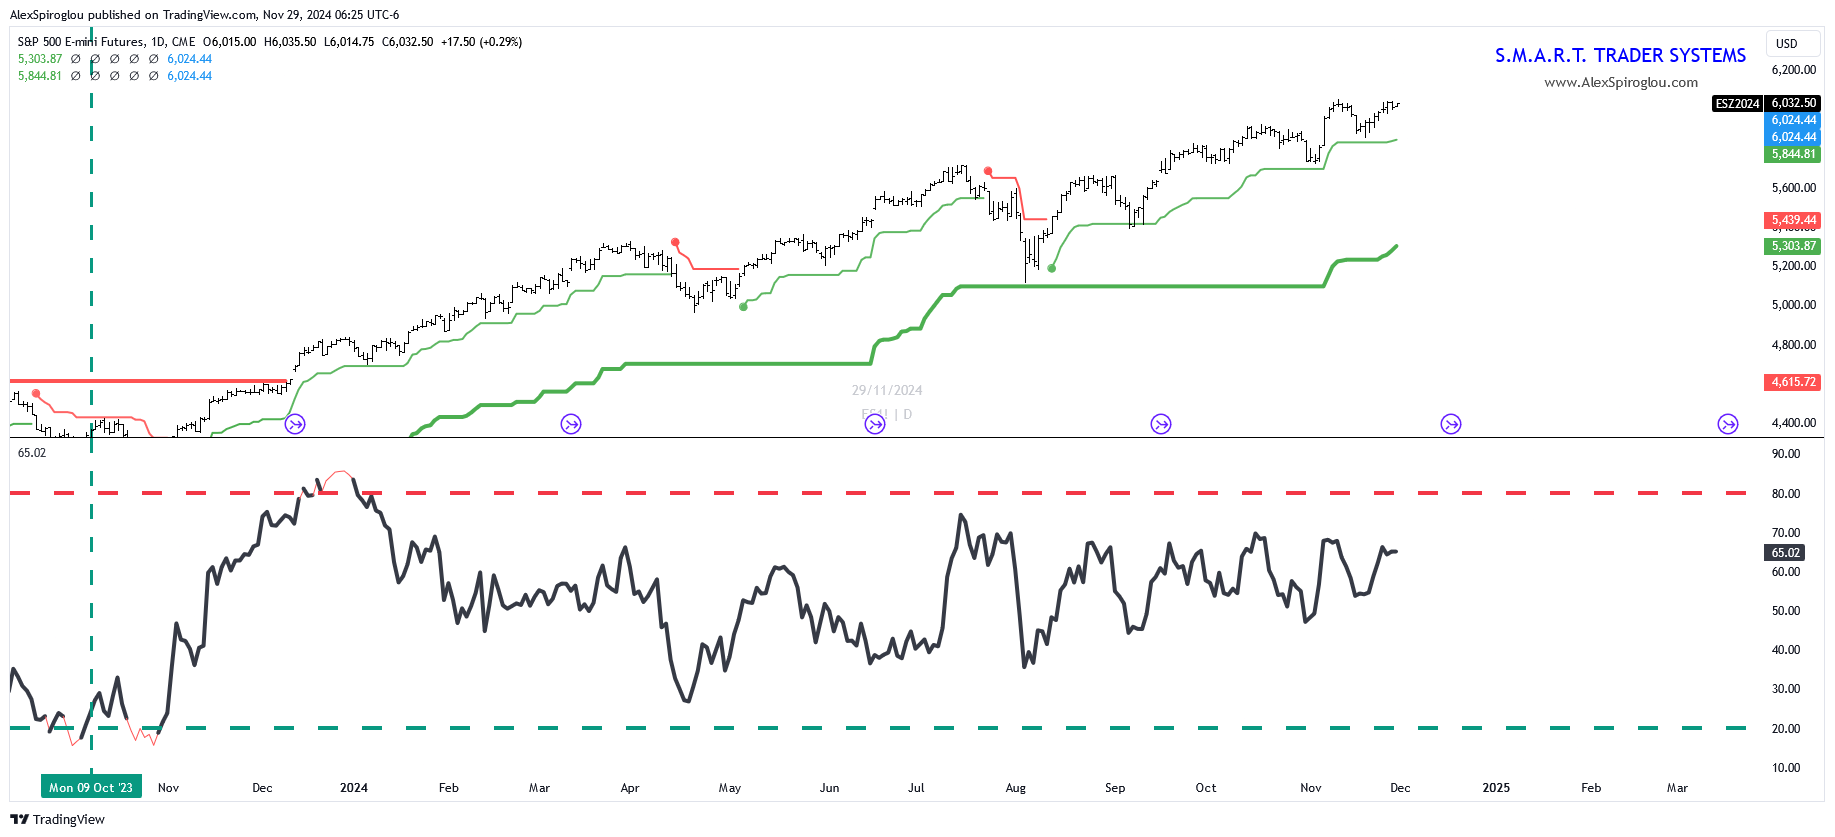
The chart of the S&P 500 alongside the percentage of NYSE stocks trading above their 50-day Exponential Moving Average (EMA) provides a snapshot of market breadth —a measure of participation across individual stocks.

Currently, 65% of NYSE stocks are above their 50 EMA, a healthy sign indicating broad market participation in the upward trend.

Market breadth is an important indicator for understanding overall market momentum. The percentage above the 50 EMA highlights how many stocks are in a short-term bullish phase. When a large proportion of stocks exceed this threshold, it often suggests robust underlying strength in the market. Conversely, a decline below key levels may signal weakening participation and potential trend reversals.

At 65%, the breadth suggests the market is in a favorable position, yet it has not reached extreme levels that typically warn of overbought conditions or momentum exhaustion.

Historically, readings closer to 80% or higher often coincide with temporary peaks, as buying pressure becomes overstretched. This middle-ground level reflects sustained bullish momentum without the risks associated with euphoria.

Monitoring market breadth helps traders gauge whether the broader market supports price action in major indices like the S&P 500. A divergence, where the index rises but breadth declines, can be an early warning of weakening momentum. For now, the positive breadth supports the current rally, reinforcing confidence in the market’s short-term trend.

Chart

Author

Alex Spiroglou, CFTe, DipTA (ATAA)

Alex Spiroglou is a quasi-systematic, cross-asset proprietary futures trader. His involvement with capital markets began in 1998, having worked for various proprietary trading and investment management firms in the UK and Greece.

More from Alex Spiroglou, CFTe, DipTA (ATAA)
Share:

Markets move fast. We move first.

Orange Juice Newsletter brings you expert driven insights - not headlines. Every day on your inbox.

By subscribing you agree to our Terms and conditions.

Editor's Picks

EUR/USD eases to daily lows near 1.1720

EUR/USD now comes under some mild downside pressure amid modest gains in the US Dollar, revisiting the 1.1720 region, or daily lows, as investors continue to assess the latest interest rate decision by the Federal Reserve, while gearing up for upcoming Fedspeak.

GBP/USD breaches below 1.3400 on USD bounce

Poor results from the UK calendar hurt the British Pound at the end of the week, sparking a correction in GBP/USD to the area below the 1.3400 support, hitting daily lows at the same time. Next of note across the Channel will be the BoE meeting on December 18.

Gold flirts with seven-week tops past $4,300

Gold picks up renewed upside traction and advances to multi-week highs north of the $4,300 mark per troy ounce, backed by prospects of further interest rate cuts by the Fed in the next year. The precious metal’s uptick comes despite the firmer Greenback and rising US Tresury yields.

Litecoin Price Forecast: LTC struggles to extend gains, bullish bets at risk

Litecoin (LTC) price steadies above $80 at press time on Friday, following a reversal from the $87 resistance level on Wednesday. Derivatives data suggests a bullish positional buildup while the LTC futures Open Interest declines, flashing a long squeeze risk.

Big week ends with big doubts

The S&P 500 continued to push higher yesterday as the US 2-year yield wavered around the 3.50% mark following a Federal Reserve (Fed) rate cut earlier this week that was ultimately perceived as not that hawkish after all. The cut is especially boosting the non-tech pockets of the market.

Aave Price Forecast: AAVE primed for breakout as bullish signals strengthen

Aave (AAVE) price is trading above $204 at the time of writing on Friday and approaching the upper boundary of its descending parallel channel; a breakout from this structure would favor the bulls.