|

Silver: XAG/USD drops as a doji emerge, while indicators suggest a potential pullback

  • Silver price retreats after hitting daily high on upbeat US economic data.
  • Upward momentum for XAG/USD remains despite recent losses.
  • XAG/USD may drop unless it holds above a critical support level.

Silver price retraces after hitting a daily high of $25.37, last seen at around $25.05, as US Treasury bond yields edged up, following upbeat US economic data. At the time of writing, the XAG/USD is trading at $25.05, down 0.83%.

XAG/USD Price Analysis

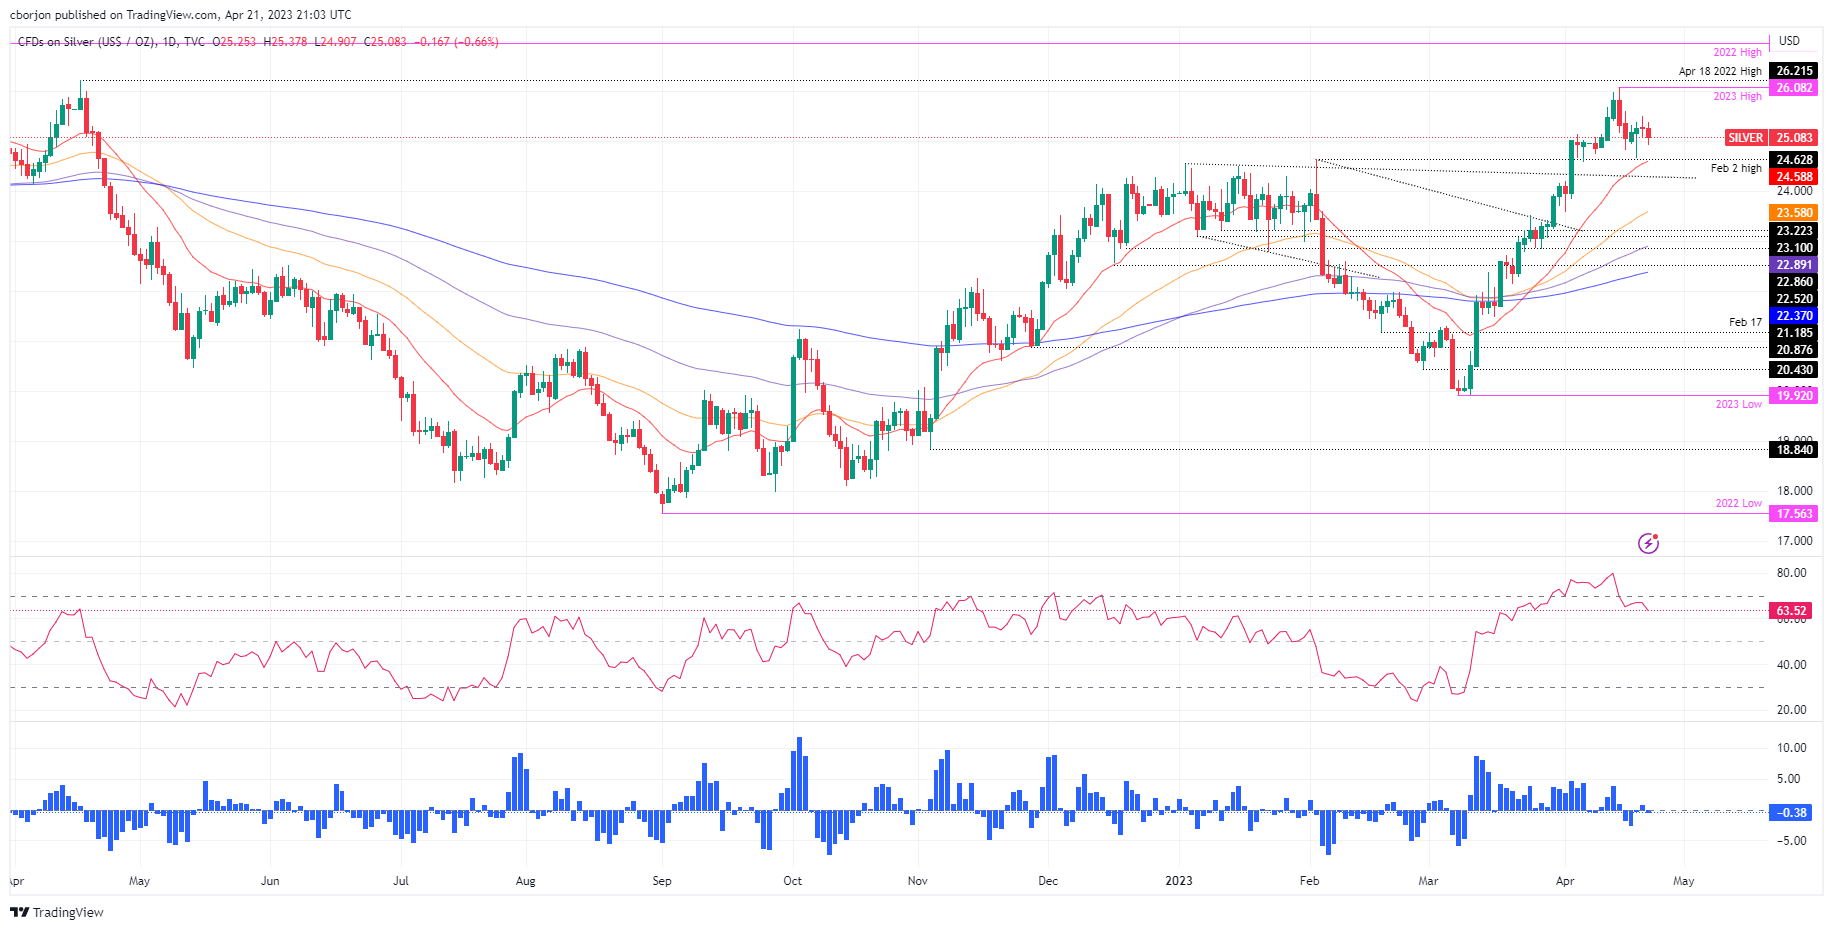
XAG/USD remains upward biased, although it posted back-to-back days of losses, led by Thursday’s price action, which printed a doji, followed by a bearish candlestick, about to close below the April 20 low of $25.06. However, the uptrend remains in play unless the XAG/USD drops below the confluence of the April 19 low and the 20-day EMA around $25.58/65.

If XAG/USD clears April’s 20 high at $25.49, it could exacerbate a rally to the YTD high of $26.08. A breach of the latter will expose the last year’s high at $26.95, shy of the $27.00 figure.

Conversely, the XAG/USD could test February’s 2 high-turned-support at $24.63, immediately followed by the 20-day EMA. If the Relative Strength Index (RSI) continues to drop, as it has done since six-days ago, a test of the $24.00 figure is on the cards. Downside risks remain eyed at the 50-day EMA at

XAG/USD Daily Char

XAG/USD Daily Chart

XAG/USD

Overview
Today last price25.1
Today Daily Change-0.19
Today Daily Change %-0.75
Today daily open25.29
 
Trends
Daily SMA2024.52
Daily SMA5022.69
Daily SMA10023.08
Daily SMA20021.38
 
Levels
Previous Daily High25.5
Previous Daily Low25.06
Previous Weekly High26.09
Previous Weekly Low24.72
Previous Monthly High24.16
Previous Monthly Low19.9
Daily Fibonacci 38.2%25.33
Daily Fibonacci 61.8%25.23
Daily Pivot Point S125.07
Daily Pivot Point S224.84
Daily Pivot Point S324.63
Daily Pivot Point R125.51
Daily Pivot Point R225.72
Daily Pivot Point R325.95

Author

Christian Borjon Valencia

Christian Borjon began his career as a retail trader in 2010, mainly focused on technical analysis and strategies around it. He started as a swing trader, as he used to work in another industry unrelated to the financial markets.

More from Christian Borjon Valencia
Share:

Markets move fast. We move first.

Orange Juice Newsletter brings you expert driven insights - not headlines. Every day on your inbox.

By subscribing you agree to our Terms and conditions.

Editor's Picks

EUR/USD holds steady near 1.1650 ahead of US data

EUR/USD stabilizes near 1.1650 on Friday after facing a rejection once again near seven-week highs. The pair, however, continues to draw support from persistent US Dollar weakness, despite a cautious market mood. Traders now await the US September PCE inflation and UoM Consumer Sentiment data. 

GBP/USD clings to gains in 1.3350 region, eyes on US data

GBP/USD sticks to a positive bias near 1.3350 in the second half of the day on Friday. Traders prefer to wait on the sidelines ahead of the key US inflation and sentiment data due later in the day. In the meantime, broad-based US Dollar weakness helps the pair stay afloat. 

Gold remains below $4,250 as traders await key US data

Gold gains some positive traction on Friday and trades in the upper half of its weekly range. Dovish Fed expectations continue to undermine the USD and lend support to the commodity. Bulls, however, might opt to wait for the US PCE Price Index before placing aggressive bets.

UoM Consumer Sentiment Index expected to post a mild recovery in December

December’s preliminary Michigan Consumer Sentiment Index is forecast to have picked up to 52 from a three-year low of 51.0 in November. A stalled labour market and higher price pressures are likely to weigh on consumers’ confidence.

Week ahead – Rate cut or market shock? The Fed decides

Fed rate cut widely expected; dot plot and overall meeting rhetoric also matter. Risk appetite is supported by Fed rate cut expectations; cryptos show signs of life. RBA, BoC and SNB also meet; chances of surprises are relatively low.

Pi Network Price Forecast: Bearish streak nears critical support trendline

Pi Network (PI) edges lower on Friday for the third consecutive day, approaching a local support trendline. The on-chain data suggests an increase in supply pressure as Centralized Exchanges (CEXs) experience a surge in inflows.