Silver trims early gains, holds above 50-day EMA as weak US CPI tempers Fed tightening bets
- XAG/USD erases earlier gains after surging nearly 2% during the Asian session on Tuesday.
- April US CPI came in softer than expected, reinforcing expectations that the Fed will maintain a patient stance.
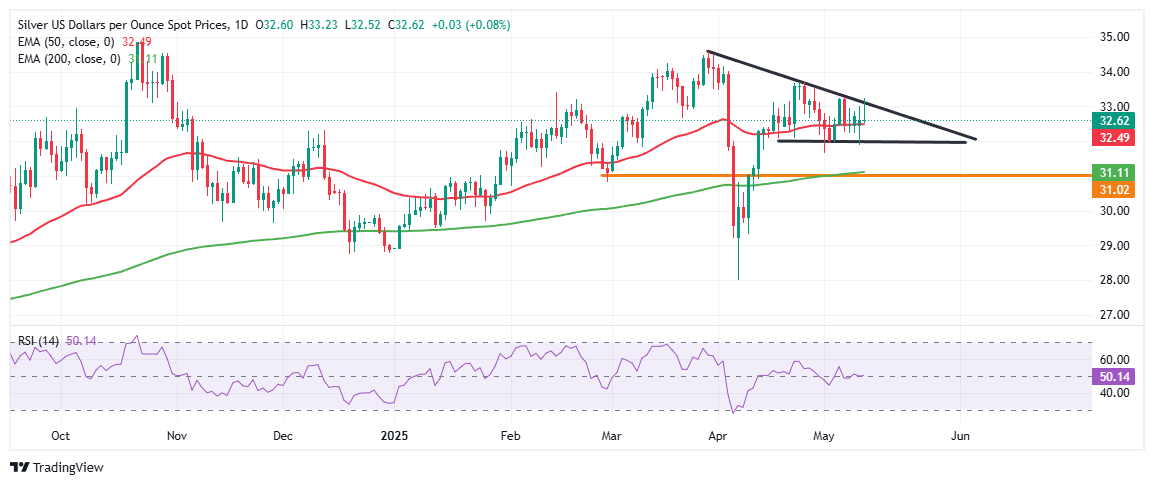
- Price tests 50-day EMA at $32.50, symmetrical triangle formation keeps the broader trend indecisive.

Silver (XAG/USD) is hovering above the 50-day Exponential Moving Average (EMA) near $32.50 at the time of writing on Tuesday. However, the white metal experienced notable volatility, initially rallying close to 2% during the Asian session. Still, the rally lost steam ahead of the US Consumer Price Index (CPI) release, with XAG/USD retreating and paring all intraday gains as traders grew cautious. The metal has since found some stability following a weaker-than-expected inflation print, reviving hopes for an interest rate cut by the Federal Reserve (Fed) in the coming months.
According to the US Bureau of Labor Statistics, headline CPI eased to 2.3% year-over-year in April – its lowest reading since February 2021 and slightly below the 2.4% market forecast. On a month-over-month basis, CPI rose 0.2%, recovering from a 0.1% contraction in March but still under the projected 0.3% increase. Meanwhile, core inflation held steady at 2.8% annually, staying at a four-year low.
The softer inflation print will reduce pressure on the Fed to keep interest rates elevated and could revive hopes of rate cuts, improving sentiment toward non-yielding assets like silver.
Adding to the tailwinds, markets are also digesting the implications of a 90-day tariff rollback between the US and China. Under the agreement, both countries agreed to reduce tariffs to 30% and 10%, respectively, providing a temporary lift to risk appetite. US Treasury Secretary Scott Bessent confirmed plans to meet with Chinese counterparts in the coming weeks to explore the framework for a broader trade agreement.
Technical analysis: Silver consolidates below key resistance as symmetrical triangle tightens
XAG/USD is holding near $32.50 in Tuesday's session, consolidating beneath a key descending trendline resistance around the $33.00 mark. The price action is compressing into the apex of a symmetrical triangle on the daily chart, signaling a potential breakout in either direction.
The 50-day Exponential Moving Average (EMA) stands at $32.50, a level that has consistently acted as strong dynamic support in recent sessions. The next downside support lies at the $32.00 psychological level. A firm break below this zone could trigger deeper losses toward the $31.00 psychological region, which aligns with the 200-day EMA at $31.11 – last visited in mid-April.
On the momentum side, the Relative Strength Index (RSI) on the daily chart is flat at 50.14, signaling indecision and a lack of momentum in either direction. Broadly, the pair remains locked within a symmetrical triangle pattern, suggesting traders are awaiting a fundamental catalyst to trigger the next breakout. A decisive move above the descending trendline near $33.00 could fuel bullish momentum toward $34.00 and eventually $35.00.
However, failure to break above resistance and a drop below $31.00 would negate the bullish bias and invite fresh selling pressure.
Author

Vishal Chaturvedi
FXStreet
I am a macro-focused research analyst with over four years of experience covering forex and commodities market. I enjoy breaking down complex economic trends and turning them into clear, actionable insights that help traders stay ahead of the curve.


