Silver Price Forecast: XAG/USD tests rising channel support, momentum indicators flash caution
- Silver trades flat-to-lower as safe-haven flows ease on Iran–Israel ceasefire news.
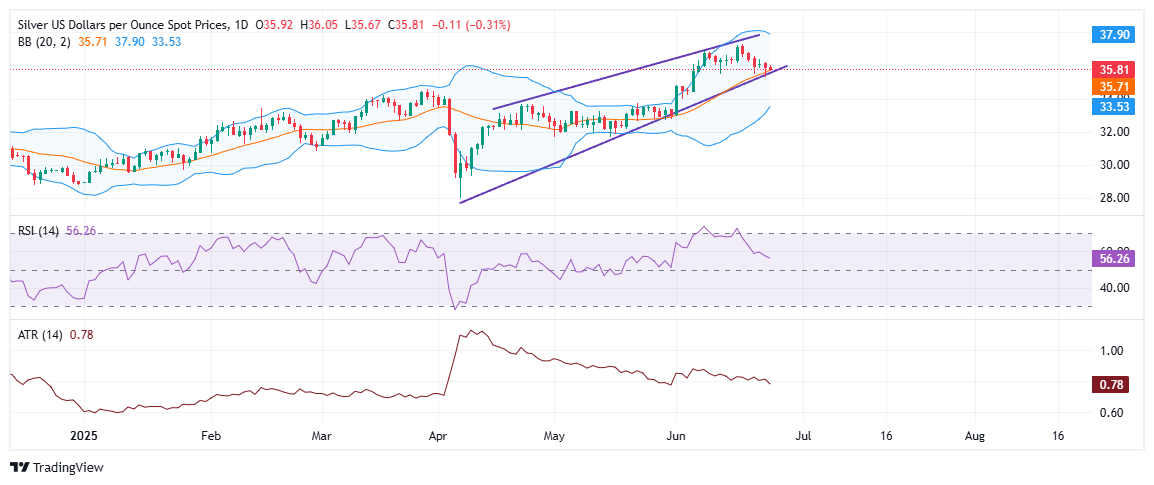
- XAG/USD trades near $35.75, down 0.46%, trapped in Tuesday’s range.
- Price tests key trendline and Bollinger Band support, breakdown may expose $34.00 next.

Silver (XAG/USD) is showing muted price action on Wednesday, slipping modestly lower but staying within Tuesday’s range. At the time of writing, the metal is trading around $35.75 during the American session, down roughly 0.46% on the day. The subdued movement reflects fading safe-haven demand, as signs of easing geopolitical tensions — particularly the truce between Iran and Israel — have cooled the recent risk premium that helped drive Silver to multi-year highs.
Silver is showing early signs of technical fatigue after a strong multi-week uptrend that saw the metal climb from sub-$30 levels to 13-year highs near $37.00. One of the key red flags came from a bearish divergence between price action and the Relative Strength Index (RSI). While spot Silver pushed to fresh multi-year highs last week, the RSI peaked earlier and has since trended lower. With RSI now easing toward 56, the bullish momentum appears to be moderating, inviting cautious profit-taking from short-term traders
Today’s price action sees XAG/USD trading near $35.75, modestly lower on the day, as it currently tests the lower boundary of a well-defined ascending channel. This structure has underpinned bullish momentum since mid-April. This support zone aligns closely with the middle Bollinger Band (20-day SMA), currently around $35.71. A decisive daily close below this confluence area could be the first concrete signal that bulls are losing grip.
The Bollinger Bands have started to contract after widening sharply during Silver’s rally. Such narrowing typically precedes a significant directional move. If the lower channel support around $35.60–$35.70 gives way, it could open the door toward deeper retracements near $34.00.
Volatility, as captured by the Average True Range (ATR 14), has also tapered off to 0.78, suggesting that the explosive moves of early June are giving way to more measured price action. This could mean that the market is entering a consolidation phase or preparing for a breakout reversal.
That said, the broader trend remains bullish unless a confirmed breakdown occurs. Traders will be watching whether bulls can defend this technical inflection zone and bounce back toward $37.00, or if the weight of profit-taking and reduced safe-haven flows forces a steeper correction.
Silver FAQs
Silver is a precious metal highly traded among investors. It has been historically used as a store of value and a medium of exchange. Although less popular than Gold, traders may turn to Silver to diversify their investment portfolio, for its intrinsic value or as a potential hedge during high-inflation periods. Investors can buy physical Silver, in coins or in bars, or trade it through vehicles such as Exchange Traded Funds, which track its price on international markets.
Silver prices can move due to a wide range of factors. Geopolitical instability or fears of a deep recession can make Silver price escalate due to its safe-haven status, although to a lesser extent than Gold's. As a yieldless asset, Silver tends to rise with lower interest rates. Its moves also depend on how the US Dollar (USD) behaves as the asset is priced in dollars (XAG/USD). A strong Dollar tends to keep the price of Silver at bay, whereas a weaker Dollar is likely to propel prices up. Other factors such as investment demand, mining supply – Silver is much more abundant than Gold – and recycling rates can also affect prices.
Silver is widely used in industry, particularly in sectors such as electronics or solar energy, as it has one of the highest electric conductivity of all metals – more than Copper and Gold. A surge in demand can increase prices, while a decline tends to lower them. Dynamics in the US, Chinese and Indian economies can also contribute to price swings: for the US and particularly China, their big industrial sectors use Silver in various processes; in India, consumers’ demand for the precious metal for jewellery also plays a key role in setting prices.
Silver prices tend to follow Gold's moves. When Gold prices rise, Silver typically follows suit, as their status as safe-haven assets is similar. The Gold/Silver ratio, which shows the number of ounces of Silver needed to equal the value of one ounce of Gold, may help to determine the relative valuation between both metals. Some investors may consider a high ratio as an indicator that Silver is undervalued, or Gold is overvalued. On the contrary, a low ratio might suggest that Gold is undervalued relative to Silver.
Author

Vishal Chaturvedi
FXStreet
I am a macro-focused research analyst with over four years of experience covering forex and commodities market. I enjoy breaking down complex economic trends and turning them into clear, actionable insights that help traders stay ahead of the curve.


