|

Silver Price Forecast: XAG/USD struggles to sustain above $29 as Fed signals fewer rate cuts this year

  • Silver price appears to be failing to maintain trade above $29.00 as the Fed sees only one rate cut this year.
  • US bond yields rise despite traders holding Fed rate-cut bets for September.
  • Investors await the US PPI data for further action.

Silver price (XAG/USD) struggles to gain ground above the crucial support of $29.00 in Thursday’s early European session. The white metal weakens as the Federal Reserve’s (Fed) dot plot of the June meeting has indicated that policymakers see only one rate cut this year. A few policymakers also advocated for maintaining the current interest rate framework for the entire year as they are less confident about inflation declining to the desired rate of 2%.

The appeal for precious metals remains vulnerable even though Fed Chair Jerome Powell acknowledged that there is a slower progress in the disinflation process and the Consumer Price Index (CPI) data for May was cooler than expected.

Meanwhile, the US Dollar Index (DXY) has extended its recovery to 104.80 and 10-year US Treasury yields bounce back to 4.33% albeit the CME FedWatch tool shows that traders hold their bets for the Fed to reduce interest rates in the September meeting. Higher yields on interest-bearing assets increase the opportunity cost of holding an investment in non-yielding assets such as Silver.

Going forward, investors will focus on the US Producer Price Index (PPI) data for May, which will be published at 12:30 GMT. Annual headline PPI is estimated to have accelerated to 2.5% from 2.2% in April, with core reading growing steadily by 2.4%.

Silver technical analysis

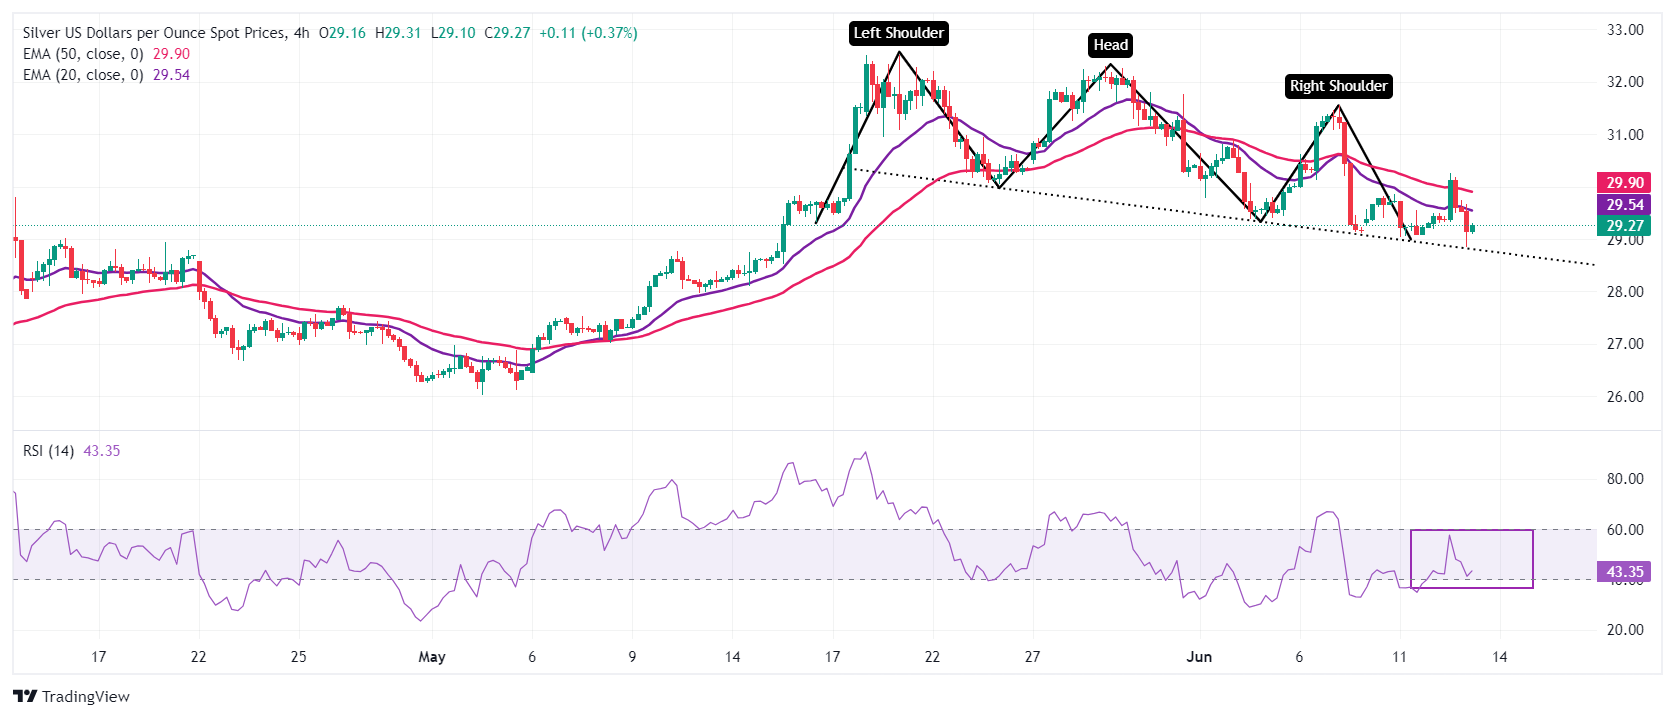
Silver price will likely deliver a breakdown of the neckline of the Head and Shoulder (H&S) chart pattern, which is marked from May 24 low at $30.00 on a four-hour timeframe. A breakdown of the above-mentioned chart pattern results in a bearish reversal.

The near-term outlook remains uncertain as 20 and 50-day Exponential Moving Averages (EMAs) near $29.50 and $29.90, respectively, are declining.

The 14-period Relative Strength Index (RSI) hovers near 40.00. A bearish momentum would trigger if it breaks below the same.

Silver four-hour chart

XAG/USD

Overview
Today last price29.18
Today Daily Change-0.55
Today Daily Change %-1.85
Today daily open29.73
 
Trends
Daily SMA2030.65
Daily SMA5028.89
Daily SMA10026.28
Daily SMA20024.72
 
Levels
Previous Daily High30.26
Previous Daily Low29.18
Previous Weekly High31.55
Previous Weekly Low29.12
Previous Monthly High32.51
Previous Monthly Low26.02
Daily Fibonacci 38.2%29.85
Daily Fibonacci 61.8%29.59
Daily Pivot Point S129.19
Daily Pivot Point S228.65
Daily Pivot Point S328.12
Daily Pivot Point R130.26
Daily Pivot Point R230.8
Daily Pivot Point R331.33

Author

Sagar Dua

Sagar Dua

FXStreet

Sagar Dua is associated with the financial markets from his college days. Along with pursuing post-graduation in Commerce in 2014, he started his markets training with chart analysis.

More from Sagar Dua
Share:

Markets move fast. We move first.

Orange Juice Newsletter brings you expert driven insights - not headlines. Every day on your inbox.

By subscribing you agree to our Terms and conditions.

Editor's Picks

EUR/USD consolidates below 1.1700 as markets turn risk-averse

EUR/USD struggles to stage a rebound and trades near the lower limit of its weekly range below 1.1700 on Thursday. The US Dollar benefits from the cautious market stance and doesn't allow the pair to gain traction ahead of mid-tier data releases.

GBP/USD stays in red near 1.3450 on broad USD resilience

GBP/USD stays on the back foot after posting losses for two consecutive days and trades near 1.3450 on Thursday. The souring market mood amid simmering geopolitical tensions make it difficult for the pair to gain traction as focus shift to the the US labor market data.

Gold sticks to intraday losses below $4,450; seems vulnerable to slide further

Gold maintains its offered tone in the second half of the day and trades below $4,450 after posting daily losses on Wednesday. The downfall lacks any obvious fundamental catalyst and could be attributed to some follow-through profit-taking ahead of the release of the US Nonfarm Payrolls report on Friday. 

Pi Network flashes bearish potential as selling pressure mounts

Pi Network trades above $0.2000 at press time on Thursday, following a nearly 2% decline the previous day. Centralized Exchanges have received 1.90 million PI tokens over the last 24 hours, suggesting risk-off sentiment among holders. The technical outlook for the PI token remains bearish, with a risk of a cross below the 20-day Exponential Moving Average. 

2026 economic outlook: Clear skies but don’t unfasten your seatbelts yet

Most years fade into the background as soon as a new one starts. Not 2025: a year of epochal shifts, in which the macroeconomy was the dog that did not bark. What to expect in 2026? The shocks of 2025 will not be undone, but neither will they be repeated.

Pi Network Price Forecast: PI flashes bearish potential as selling pressure mounts

Pi Network trades above $0.2000 at press time on Thursday, following a nearly 2% decline the previous day. Centralized Exchanges have received 1.90 million PI tokens over the last 24 hours, suggesting risk-off sentiment among holders.