Silver Price Forecast: XAG/USD strives to hold $33 amid renewed Sino-US trade worries
- Silver price looks for a temporary support after sliding almost 1% to near $33.00 as trade tensions between the US and China have renewed.
- Trump accused China for non-compliance of trade agreement.
- The US PCE inflation cools down in April.

Silver price (XAG/USD) is down almost 1% near the key level of $33.00 during North American trading house on Friday. However, the white metal strives to gain ground as renewed trade tensions between the United States (US) and China are limited the upside in the US Dollar (USD).
The US Dollar Index (DXY), which tracks the Greenback’s value against six major currencies, struggles to extend its early recovery move above the immediate resistance of 99.70.
Historically, global economic tensions improve demand for safe-haven assets, such as Silver. However, it is struggling to find bids as higher US Dollar makes investment in Silver price an expensive bet for investors.
During North American session, US President Donald Trump accused Beijing for non-compliance on the trade agreement in a post on Truth.Social. "The bad news is that China, perhaps not surprisingly to some, has totally violated its agreement with us," Trump wrote.
Meanwhile, soft US Personal Consumption Expenditure Price Index (PCE) data for April has weighed some pressure on the Silver. The US core PCE inflation, a Federal Reserve’s (Fed) preferred inflation gauge, rose by 2.5% on year, as expected, slower than 2.7% in March. Precious metals underperform in a low-inflation environment.
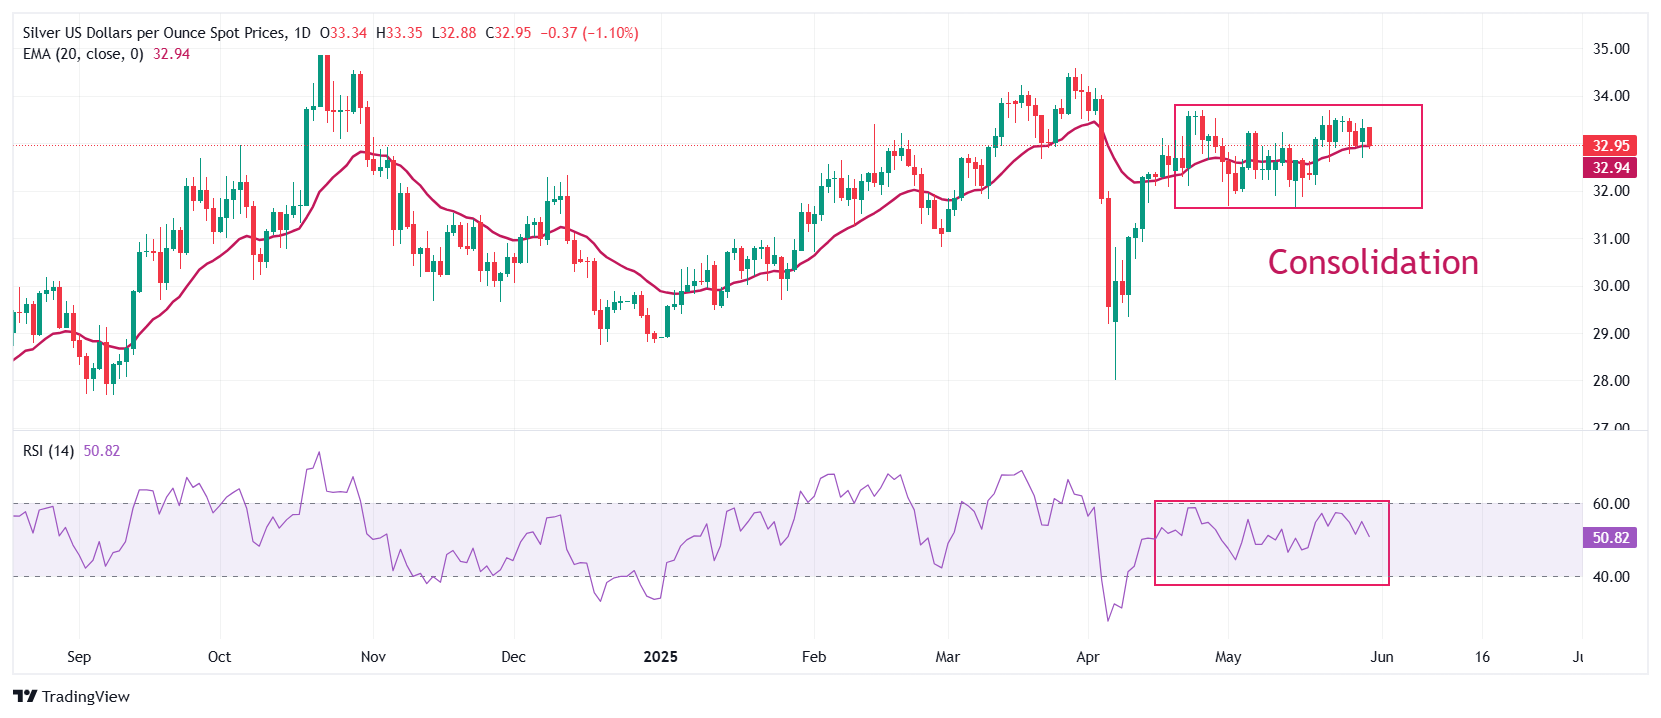
Silver technical analysis
Silver price ranges between $31.65 and $33.70 from over a month. The near-term trend of the white metal is uncertain as it wobbles around the 20-period Exponential Moving Average (EMA), which trades near $32.90.
The 14-period Relative Strength Index (RSI) oscillates inside the 40.00-60.00 range, indicating a sideways trend.
Looking up, the March 28 high of $34.60 will act as key resistance for the metal. On the downside, the April 11 low of $30.90 will be the key support zone.
Silver daily chart
Silver FAQs
Silver is a precious metal highly traded among investors. It has been historically used as a store of value and a medium of exchange. Although less popular than Gold, traders may turn to Silver to diversify their investment portfolio, for its intrinsic value or as a potential hedge during high-inflation periods. Investors can buy physical Silver, in coins or in bars, or trade it through vehicles such as Exchange Traded Funds, which track its price on international markets.
Silver prices can move due to a wide range of factors. Geopolitical instability or fears of a deep recession can make Silver price escalate due to its safe-haven status, although to a lesser extent than Gold's. As a yieldless asset, Silver tends to rise with lower interest rates. Its moves also depend on how the US Dollar (USD) behaves as the asset is priced in dollars (XAG/USD). A strong Dollar tends to keep the price of Silver at bay, whereas a weaker Dollar is likely to propel prices up. Other factors such as investment demand, mining supply – Silver is much more abundant than Gold – and recycling rates can also affect prices.
Silver is widely used in industry, particularly in sectors such as electronics or solar energy, as it has one of the highest electric conductivity of all metals – more than Copper and Gold. A surge in demand can increase prices, while a decline tends to lower them. Dynamics in the US, Chinese and Indian economies can also contribute to price swings: for the US and particularly China, their big industrial sectors use Silver in various processes; in India, consumers’ demand for the precious metal for jewellery also plays a key role in setting prices.
Silver prices tend to follow Gold's moves. When Gold prices rise, Silver typically follows suit, as their status as safe-haven assets is similar. The Gold/Silver ratio, which shows the number of ounces of Silver needed to equal the value of one ounce of Gold, may help to determine the relative valuation between both metals. Some investors may consider a high ratio as an indicator that Silver is undervalued, or Gold is overvalued. On the contrary, a low ratio might suggest that Gold is undervalued relative to Silver.
Author

Sagar Dua
FXStreet
Sagar Dua is associated with the financial markets from his college days. Along with pursuing post-graduation in Commerce in 2014, he started his markets training with chart analysis.


