• Silver rebounds from last week’s low of $35.51, climbs above $36.00 with 1.7% recovery.
  • RSI points to bullish momentum; key resistance at $36.50 and $37.32 yearly high.
  • Close below $36.00 could expose support levels at $35.46 and $34.59.

Silver prices stabilized as the week began, rising 0.39%, as slight risk aversion amid heightened geopolitical tensions provided support. XAG/USD reached a daily high of $36.36 before settling at $36.14, ending three days of losses.

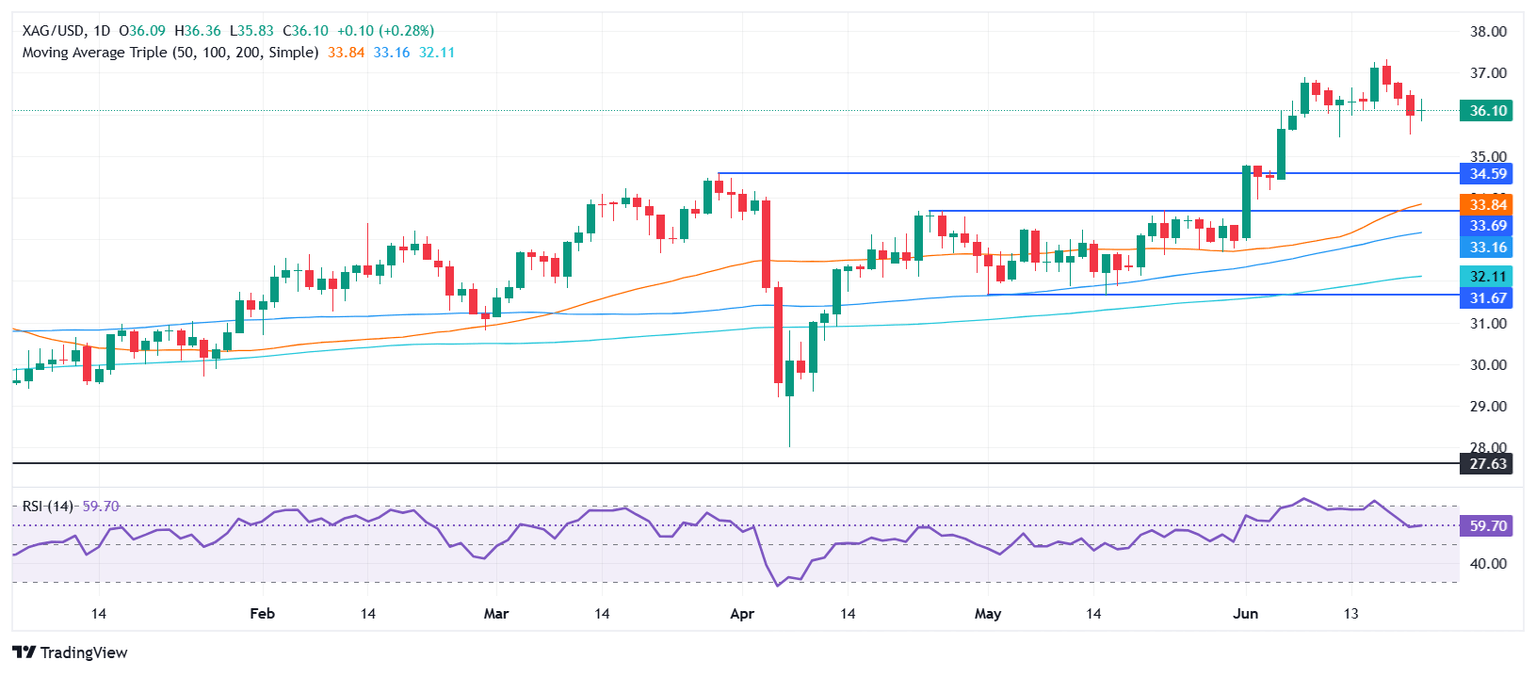
XAG/USD Price Forecast: Technical outlook

Silver remains upwardly biased, despite hitting a weekly low of $35.51 last week. Since then, XAG/USD recovered over 1.70%, lifting the grey metal price above $36.00, and paving the way for further upside.

The Relative Strength Index (RSI) shows that buyers remain in control. Therefore, further upside is seen.

If XAG/USD rises past $36.50, this will expose the $37.00 figure. The next supply zone of interest would be the June 18 yearly high at $37.32, ahead of $37.50

Conversely, a daily close below $36.00 could sponsor a move towards the June 12 swing low of $35.46, ahead of March 28 peak turned support at $34.59.

XAG/USD Price Chart – Daily

Silver FAQs

Silver is a precious metal highly traded among investors. It has been historically used as a store of value and a medium of exchange. Although less popular than Gold, traders may turn to Silver to diversify their investment portfolio, for its intrinsic value or as a potential hedge during high-inflation periods. Investors can buy physical Silver, in coins or in bars, or trade it through vehicles such as Exchange Traded Funds, which track its price on international markets.

Silver prices can move due to a wide range of factors. Geopolitical instability or fears of a deep recession can make Silver price escalate due to its safe-haven status, although to a lesser extent than Gold's. As a yieldless asset, Silver tends to rise with lower interest rates. Its moves also depend on how the US Dollar (USD) behaves as the asset is priced in dollars (XAG/USD). A strong Dollar tends to keep the price of Silver at bay, whereas a weaker Dollar is likely to propel prices up. Other factors such as investment demand, mining supply – Silver is much more abundant than Gold – and recycling rates can also affect prices.

Silver is widely used in industry, particularly in sectors such as electronics or solar energy, as it has one of the highest electric conductivity of all metals – more than Copper and Gold. A surge in demand can increase prices, while a decline tends to lower them. Dynamics in the US, Chinese and Indian economies can also contribute to price swings: for the US and particularly China, their big industrial sectors use Silver in various processes; in India, consumers’ demand for the precious metal for jewellery also plays a key role in setting prices.

Silver prices tend to follow Gold's moves. When Gold prices rise, Silver typically follows suit, as their status as safe-haven assets is similar. The Gold/Silver ratio, which shows the number of ounces of Silver needed to equal the value of one ounce of Gold, may help to determine the relative valuation between both metals. Some investors may consider a high ratio as an indicator that Silver is undervalued, or Gold is overvalued. On the contrary, a low ratio might suggest that Gold is undervalued relative to Silver.

Share: Feed news

Information on these pages contains forward-looking statements that involve risks and uncertainties. Markets and instruments profiled on this page are for informational purposes only and should not in any way come across as a recommendation to buy or sell in these assets. You should do your own thorough research before making any investment decisions. FXStreet does not in any way guarantee that this information is free from mistakes, errors, or material misstatements. It also does not guarantee that this information is of a timely nature. Investing in Open Markets involves a great deal of risk, including the loss of all or a portion of your investment, as well as emotional distress. All risks, losses and costs associated with investing, including total loss of principal, are your responsibility. The views and opinions expressed in this article are those of the authors and do not necessarily reflect the official policy or position of FXStreet nor its advertisers. The author will not be held responsible for information that is found at the end of links posted on this page.

If not otherwise explicitly mentioned in the body of the article, at the time of writing, the author has no position in any stock mentioned in this article and no business relationship with any company mentioned. The author has not received compensation for writing this article, other than from FXStreet.

FXStreet and the author do not provide personalized recommendations. The author makes no representations as to the accuracy, completeness, or suitability of this information. FXStreet and the author will not be liable for any errors, omissions or any losses, injuries or damages arising from this information and its display or use. Errors and omissions excepted.

The author and FXStreet are not registered investment advisors and nothing in this article is intended to be investment advice.

Recommended content


Recommended content

Editors’ Picks

AUD/USD: The 200-day SMA holds the downside

AUD/USD: The 200-day SMA holds the downside

AUD/USD regained some balance, faded three daily pullbacks in a row, and regained the 0.6500 mark and beyond on Wednesday. The Aussie’s recovery came on the back of a sharp reversal in the US Dollar, exacerbated in response to another bout of Trump-Powell effervescence.

EUR/USD: Still room for extra retracements

EUR/USD: Still room for extra retracements

The sudden bout of selling pressure on the Greenback lent some breathing room to the generalised risk complex, prompting EUR/USD to reverse part of its multi-day leg lower and revisit the vicinity of the 1.1800 neighbourhood. Meanwhile, investors will now look at the upcoming US Retail Sales data and the usual weekly gauge of the labour market.

Gold back to its comfort zone around $3,350

Gold back to its comfort zone around $3,350

Gold now manages to leave behind the initial weakness and rapidly advances to the area of three-week peaks around the $3,380 mark per troy ounce as the US Dollar’s retracement gathers extra pace following another round of Trump-Powell effervescence.

Australia unemployment rate expected to hold steady in June

Australia unemployment rate expected to hold steady in June

Australia is set to release the June employment report at 1:30 GMT. The Australian Bureau of Statistics is expected to announce that the country added 20,000 new job positions in the month, reversing the 2,500 lost positions announced in May.

China’s first-half growth remains on track, though activity data signals caution

China’s first-half growth remains on track, though activity data signals caution

China's second-quarter GDP beat forecasts again with a 5.2% year-on-year growth, driven by strong trade and industrial production. Yet sharper-than-expected slowdowns in fixed-asset investment and retail sales and falling property prices are a concern.

Best Brokers for EUR/USD Trading

Best Brokers for EUR/USD Trading

SPONSORED Discover the top brokers for trading EUR/USD in 2025. Our list features brokers with competitive spreads, fast execution, and powerful platforms. Whether you're a beginner or an expert, find the right partner to navigate the dynamic Forex market.

Forex MAJORS

Cryptocurrencies

Signatures

Best Brokers of 2025