|

Silver Price Forecast: XAG/USD stays above $24 despite retreating from weekly highs

  • Silver price dips but staus nearby YTD highs as the US Dollar weakens.
  • XAG/USD is underpinned as US Treasury bond yields collapse with investors pricing a less aggressive Fed.
  • St Louis Fed President Bullard forecasts rates above 5%, says OPEC’s oil production cut will make Fed’s work “difficult.”

Silver price is trading below its opening price by around 0.37%, though it stays above the $24.00 threshold. Falling US Treasury bond yields and a soft US Dollar (USD) are two reasons for XAG/USD’s rise. At the time of writing, the XAG/USD exchanges hands at $24.01.

The sentiment is deteriorating. US equities fluctuated after the S&P and the ISM Manufacturing PMIs, showing that business activity in the US is contracting. Recessionary fears are rising, and tighter lending conditions are weighing on businesses.

Therefore, safe-haven flows towards the precious metal segment, maintaining Silver prices nearby yearly highs. US Treasury bond yields are collapsing as investors have begun to price in a less aggressive US Federal Reserve (Fed), even though an official estimates rates above 5%.

The St Louis Fed President James Bullard said that the Fed needs to raise rates above 5% and emphasized that his forecast is above the median. Bullard commented that OPEC’s cutting oil output would make the Fed’s work “difficult.”

The US Dollar Index, a measure of the buck’s performance vs. six peers, tumbles 0.41%, at 102.168.

Another reason that keeps the commodity prices higher is the Organization of Petroleum Exporting Countries and its allies’ (OPEC+) decision to reduce oil production by 1 million barrels, which led to a boost in oil prices.

XAG/USD Technical analysis

XAG/USD Daily chart

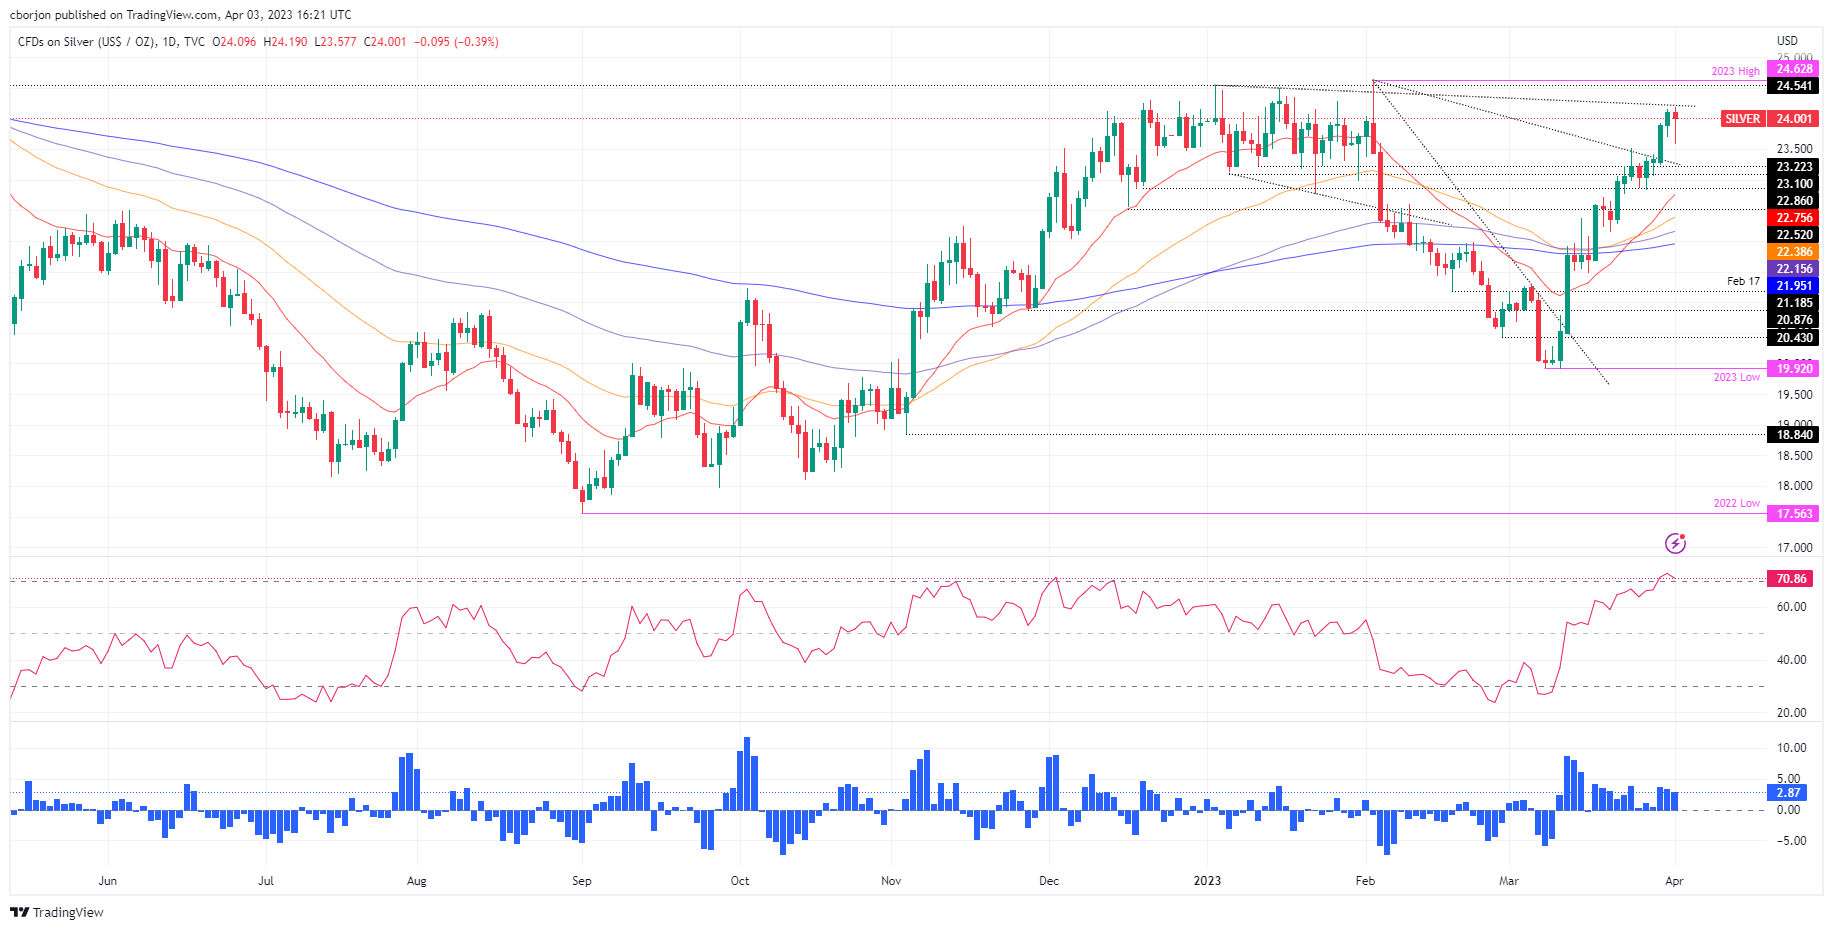
Silver’s uptrend remains intact, though testing a four-month-old resistance trendline that passes around $24.20-30. Although it opened the door for a pullback, oscillators suggest the bias remains bullish. The Relative Strength Index (RSI) is exiting overbought conditions, giving buyers a respite. At the same time, the Rate of Change (RoC), portrays that buyers remain in control but take a pause.

IF the XAG/USD breaks $24.20, it will exacerbate a test of the YTD high at $24.63, followed by the $25.00 figure. On the other hand, a daily close below $24.00 could open the door for a pullback toward the March 24 high of $23.52.

XAG/USD

Overview
Today last price24
Today Daily Change-0.08
Today Daily Change %-0.33
Today daily open24.08
 
Trends
Daily SMA2022.17
Daily SMA5022.21
Daily SMA10022.59
Daily SMA20021.03
 
Levels
Previous Daily High24.16
Previous Daily Low23.7
Previous Weekly High24.16
Previous Weekly Low22.83
Previous Monthly High24.16
Previous Monthly Low19.9
Daily Fibonacci 38.2%23.98
Daily Fibonacci 61.8%23.87
Daily Pivot Point S123.8
Daily Pivot Point S223.51
Daily Pivot Point S323.33
Daily Pivot Point R124.27
Daily Pivot Point R224.45
Daily Pivot Point R324.73

Author

Christian Borjon Valencia

Markets analyst, news editor, and trading instructor with over 14 years of experience across FX, commodities, US equity indices, and global macro markets.

More from Christian Borjon Valencia
Share:

Editor's Picks

AUD/USD eyes 0.7150 barrier nine-day EMA

AUD/USD inches higher after registering modest losses in the previous day, trading around 0.7130 during the Asian hours. The technical analysis of the daily chart indicates that the pair is moving sideways within the rectangle pattern, suggesting a consolidation as neither the bulls nor the bears have enough momentum to take control of the market.

USD/JPY trades below 160.00 intervention threshold; bullish bias intact

The USD/JPY pair attracts some sellers during the Asian session amid fears that authorities will step in again to prop up the Japanese Yen. Furthermore, the Israel-Lebanon truce prompts some profit-taking around the US Dollar and exerts downward pressure on the currency pair.

Gold defends 200-day SMA at $4,425, but for how long?

Gold is attempting a tepid recovery toward $4,500 early Thursday, as renewed optimism in the Mideast geopolitical front calms market nerves. This cautious optimism across Asian markets weighs on Oil prices, and diminishes the US Dollar’s safe-haven appeal, helping Gold stage a decent comeback from the weekly low of $4,424.


Hyperliquid: ETF demand, capital rotation fuel HYPE rally as Bitcoin melts

Hyperliquid price sustains an upward trend near its all-time high of $75.76 on Thursday after posting 80% gains in May, while Bitcoin (BTC) retraces below $65,000, triggering a market-wide panic.

Kevin Warsh takes the Fed helm: What it means for the US Dollar
The Federal Reserve moves away from the highly predictable "forward guidance" model of the Jerome Powell era to a new “Kevin Warsh environment”, characterized by less communication, more policy surprises, and an increased focus on the Fed's complex balance sheet.
Recession on paper: What really moves the Canadian Loonie now?

Statistics Canada handed the headline writers a gift and the analysts a headache. Real GDP shrank 0.1% on an annualized basis in the first quarter, and with the fourth quarter of 2025 revised down to a 1.0% contraction, that is two negative quarters in a row, the textbook definition of a technical recession and Canada's first since the pandemic.