Silver Price Forecast: XAG/USD soars above $75 as Venezuela shock sparks haven demand
- Silver spikes close to $76 as Venezuela leadership upheaval fuels demand for hard-asset hedges.
- Trump’s comments on military escalation lift geopolitical risk, supporting precious metals despite a firmer US Dollar.
- Weak US ISM Manufacturing PMI adds macro uncertainty ahead of NFPs and key US data.
Silver extends its rally on Monday, registering stellar gains of more than 4% following geopolitical events over the weekend, which featured the ousting of the President of Venezuela Nicolas Maduro, captured by US elite forces on Saturday. At the time of writing, XAG/USD trades at $75.91 a troy ounce.
XAG/USD surges over 4% on geopolitical turmoil, despite strong US Dollar
Market sentiment is mixed. Precious metals are rising, as are stocks, as seen by US equity markets rising between 0.24% and 0.89%. In the FX space, the King Dollar is back, up 0.22%, a headwind for most G10 FX currencies.
Nevertheless, precious metals could extend their advance, amid uncertainty following US President Donald Trump's comments that the US will "run" Venezuela. Furthermore, he added that if the current government, led by Vice-President Delcy Rodriguez, does not cooperate with the US, they could repeat the operation.
When asked, Trump said that military action could extend to Colombia and Mexico if they do not reduce the flow of drugs.
As of writing, the US ISM Manufacturing PMI for December 2025 missed estimates of 48.3, coming in at 47.9, indicating deterioration in the manufacturing sector.
Ahead, the US economic docket will feature the ISM Services PMI, Initial Jobless Claims for the week ending January 3 and December’s Nonfarm Payrolls.
XAG/USD Price Analysis: Technical outlook
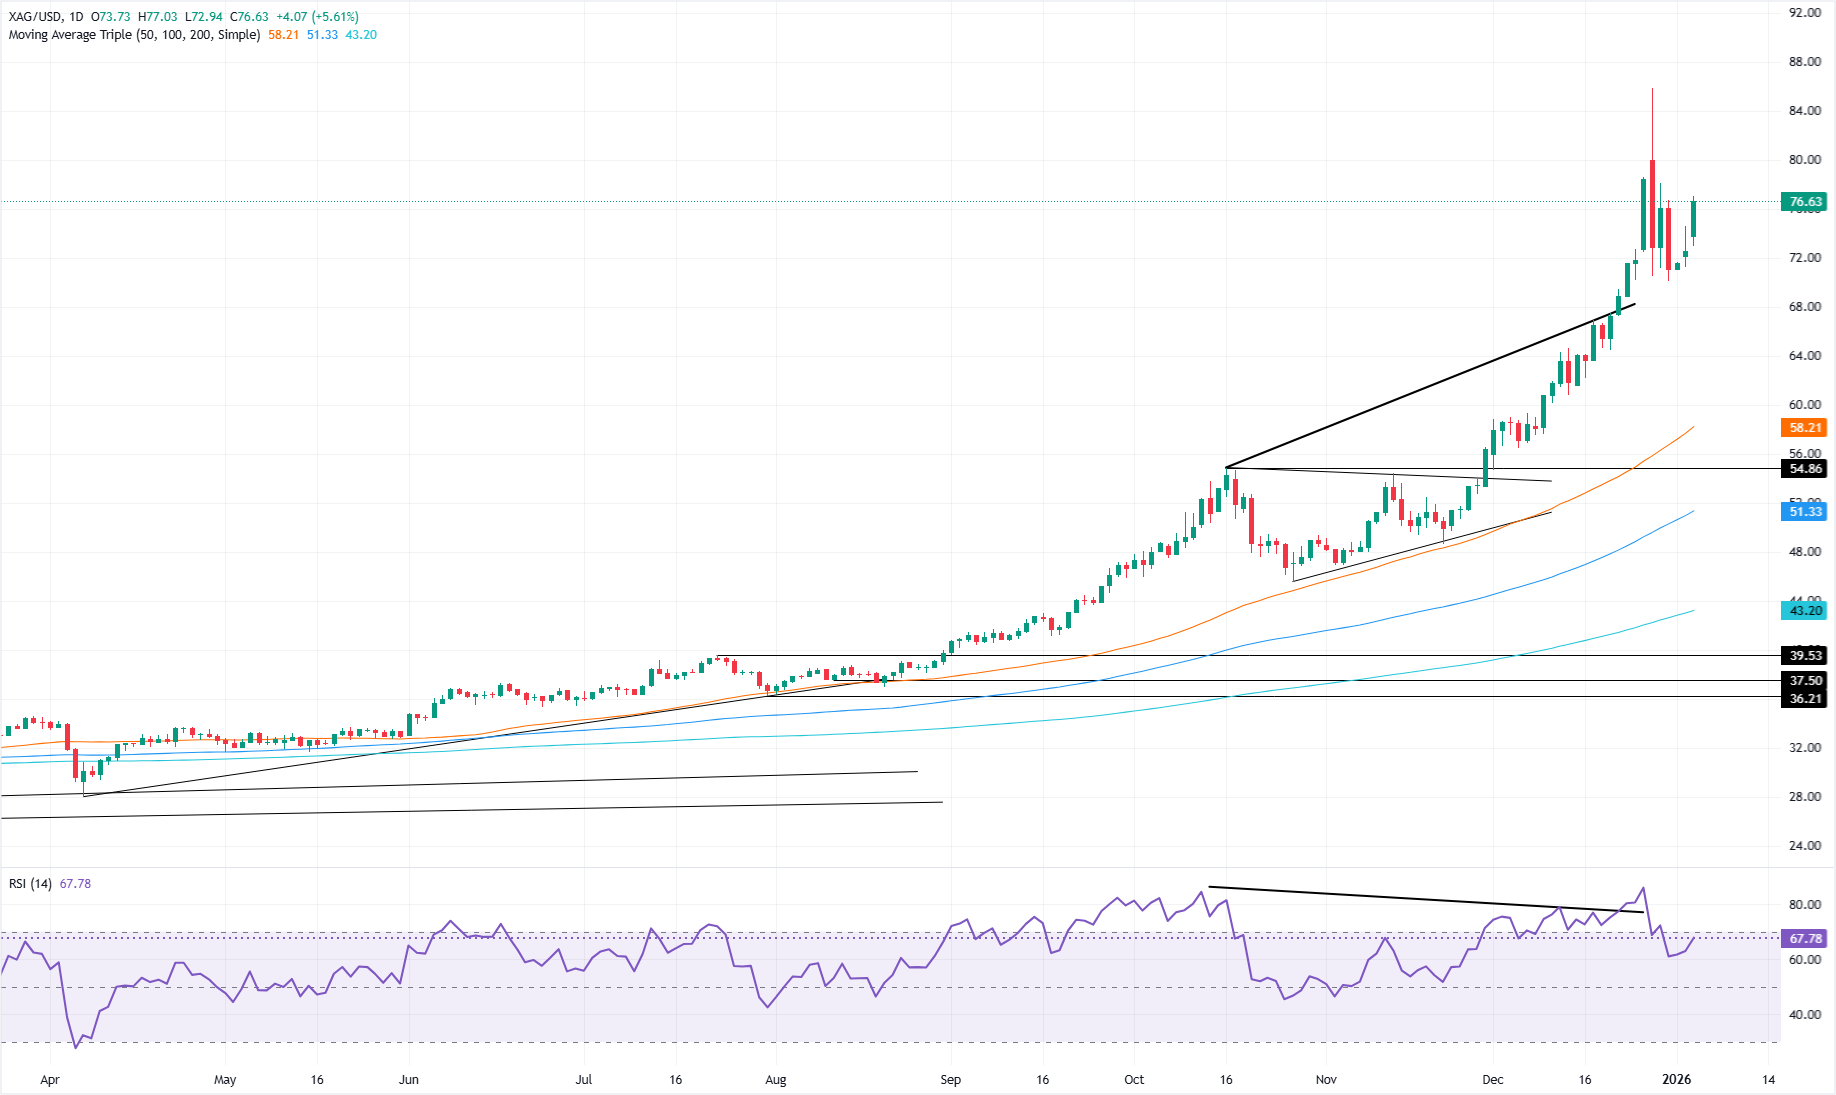
Silver uptrend remains intact, yet it seems overextended after reaching three-day highs and momentum shows signs of waning. The Relative Strength Index (RSI), although bullish, has failed to clear its latest peak. This means that the potential for a pullback looms.
Nevertheless, XAG/USD path of least resistance is upwards. The next key resistance is the December 30 high at $78.06, followed by the $79.00 figure and $80.00. On the flip side, if Silver tumbles below $75.00, the next immediate demand level would be the January 2 high turned support at $74.55 ahead of $74.00 per troy ounce.
Silver FAQs
Silver is a precious metal highly traded among investors. It has been historically used as a store of value and a medium of exchange. Although less popular than Gold, traders may turn to Silver to diversify their investment portfolio, for its intrinsic value or as a potential hedge during high-inflation periods. Investors can buy physical Silver, in coins or in bars, or trade it through vehicles such as Exchange Traded Funds, which track its price on international markets.
Silver prices can move due to a wide range of factors. Geopolitical instability or fears of a deep recession can make Silver price escalate due to its safe-haven status, although to a lesser extent than Gold's. As a yieldless asset, Silver tends to rise with lower interest rates. Its moves also depend on how the US Dollar (USD) behaves as the asset is priced in dollars (XAG/USD). A strong Dollar tends to keep the price of Silver at bay, whereas a weaker Dollar is likely to propel prices up. Other factors such as investment demand, mining supply – Silver is much more abundant than Gold – and recycling rates can also affect prices.
Silver is widely used in industry, particularly in sectors such as electronics or solar energy, as it has one of the highest electric conductivity of all metals – more than Copper and Gold. A surge in demand can increase prices, while a decline tends to lower them. Dynamics in the US, Chinese and Indian economies can also contribute to price swings: for the US and particularly China, their big industrial sectors use Silver in various processes; in India, consumers’ demand for the precious metal for jewellery also plays a key role in setting prices.
Silver prices tend to follow Gold's moves. When Gold prices rise, Silver typically follows suit, as their status as safe-haven assets is similar. The Gold/Silver ratio, which shows the number of ounces of Silver needed to equal the value of one ounce of Gold, may help to determine the relative valuation between both metals. Some investors may consider a high ratio as an indicator that Silver is undervalued, or Gold is overvalued. On the contrary, a low ratio might suggest that Gold is undervalued relative to Silver.
Author

Christian Borjon Valencia
FXStreet
Markets analyst, news editor, and trading instructor with over 14 years of experience across FX, commodities, US equity indices, and global macro markets.


