Silver Price Forecast: XAG/USD slumps to near $30 as traders reassess Fed’s interest rate outlook
- Silver price tumbles to near $30.00 as US bond yields rise after traders pare Fed dovish bets.
- US bond yields surge after the release of the surprisingly upbeat US NFP data for December.
- The overall outlook of the Silver price remains upbeat amid risk-off market sentiment.

Silver price (XAG/USD) falls sharply to near $30.00 after failing to extend its upside above the key hurdle of $30.60 in Monday’s European session. The white metal weakens as the US bond yields strengthens, with market participants reassessing their expectations for the Federal Reserve’s (Fed) monetary policy outlook after the release of the United States (US) Nonfarm Payrolls (NFP) data for December.
10-year US Treasury yields post fresh yearly high to near 4.80% as traders have pared Fed dovish bets after the release of the surprisingly upbeat labor market data. Higher yields on interest-bearing assets weigh on non-yielding assets, such as Silver, as they result in higher opportunity costs for them. The US Dollar Index (DXY), which tracks the Greenback’s value against six major currencies, posts a fresh two-year high above 110.00.
According to the CME FedWatch tool, the Fed is expected to keep interest rates unchanged in the current range of 4.25%-4.50% atleast in the next three policy meetings.
Meanwhile, the broader outlook of the Silver price remains firm as the market sentiment is bearish amid uncertainty over the incoming trade policies under the administration of US President-elect Donald Trump. The appeal of non-yielding assets strengthens in a highly uncertain environment.
This week, investors will focus on the US Consumer Price Index (CPI) data for December, which will be published on Wednesday.
Silver technical analysis
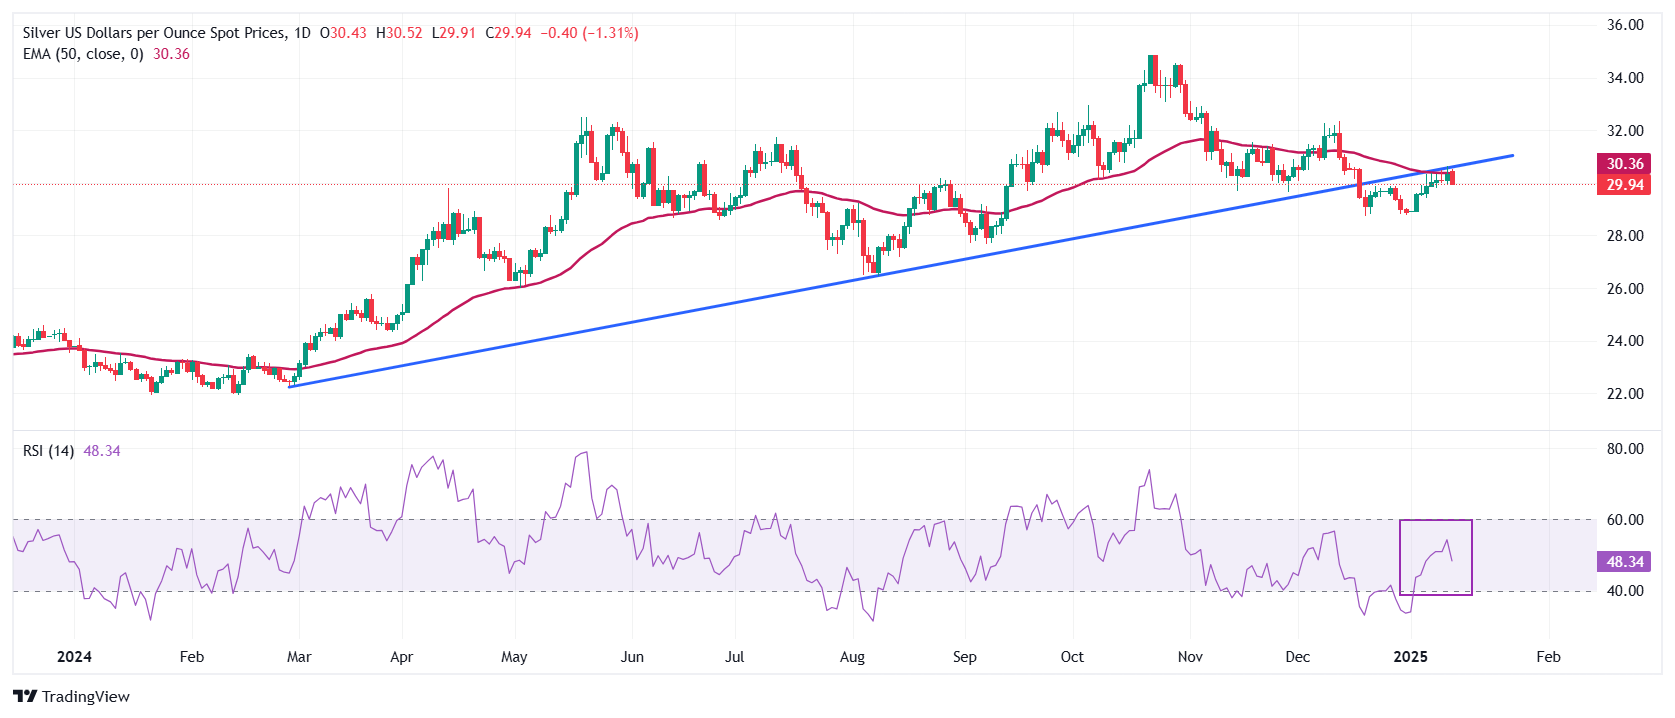
Silver price continues to face selling pressure near the 50-day Exponential Moving Average (EMA), which trades near $30.35. The white metal remains below the upward-sloping trendline around $30.50 on a daily timeframe, which is plotted from the February 29 low of $22.30
The 14-day Relative Strength Index (RSI) oscillates inside the 40.00-60.00 range, suggesting a sideways trend.
Looking down, the September low of $27.75 would act as key support for the Silver price. On the upside, the December 12 high of $32.33 would be the barrier.
Silver daily chart
Silver FAQs
Silver is a precious metal highly traded among investors. It has been historically used as a store of value and a medium of exchange. Although less popular than Gold, traders may turn to Silver to diversify their investment portfolio, for its intrinsic value or as a potential hedge during high-inflation periods. Investors can buy physical Silver, in coins or in bars, or trade it through vehicles such as Exchange Traded Funds, which track its price on international markets.
Silver prices can move due to a wide range of factors. Geopolitical instability or fears of a deep recession can make Silver price escalate due to its safe-haven status, although to a lesser extent than Gold's. As a yieldless asset, Silver tends to rise with lower interest rates. Its moves also depend on how the US Dollar (USD) behaves as the asset is priced in dollars (XAG/USD). A strong Dollar tends to keep the price of Silver at bay, whereas a weaker Dollar is likely to propel prices up. Other factors such as investment demand, mining supply – Silver is much more abundant than Gold – and recycling rates can also affect prices.
Silver is widely used in industry, particularly in sectors such as electronics or solar energy, as it has one of the highest electric conductivity of all metals – more than Copper and Gold. A surge in demand can increase prices, while a decline tends to lower them. Dynamics in the US, Chinese and Indian economies can also contribute to price swings: for the US and particularly China, their big industrial sectors use Silver in various processes; in India, consumers’ demand for the precious metal for jewellery also plays a key role in setting prices.
Silver prices tend to follow Gold's moves. When Gold prices rise, Silver typically follows suit, as their status as safe-haven assets is similar. The Gold/Silver ratio, which shows the number of ounces of Silver needed to equal the value of one ounce of Gold, may help to determine the relative valuation between both metals. Some investors may consider a high ratio as an indicator that Silver is undervalued, or Gold is overvalued. On the contrary, a low ratio might suggest that Gold is undervalued relative to Silver.
Author

Sagar Dua
FXStreet
Sagar Dua is associated with the financial markets from his college days. Along with pursuing post-graduation in Commerce in 2014, he started his markets training with chart analysis.


