• XAG/USD fall on broad US dollar strength across the board.
  • Higher US bond yields weigh on the XAG/USD.
  • From the technical perspective, a daily break below $21.65 could pressure XAG/USD towards $20.00 and beyond.

Silver (XAG/USD) is still under pressure, slumps for the second day out of three, trading at $21.54, down around 4% at the time of writing. XAG/USD slide is attributed to increasing US dollar demand, with the US Dollar Index rising 0.64%, sitting at 94.34

Market sentiment is upbeat. Major US stocks indices finished in the green, with the S&P 500 and the Dow Jones posting gains of 0.16% and 0.23%, respectively, except for the Nasdaq Composite, which dropped 0.24%, during the New York session.

Regarding US bond yields, which influence precious metals prices, the 10-year benchmark note rate seesawed around 1.524%, unchanged.

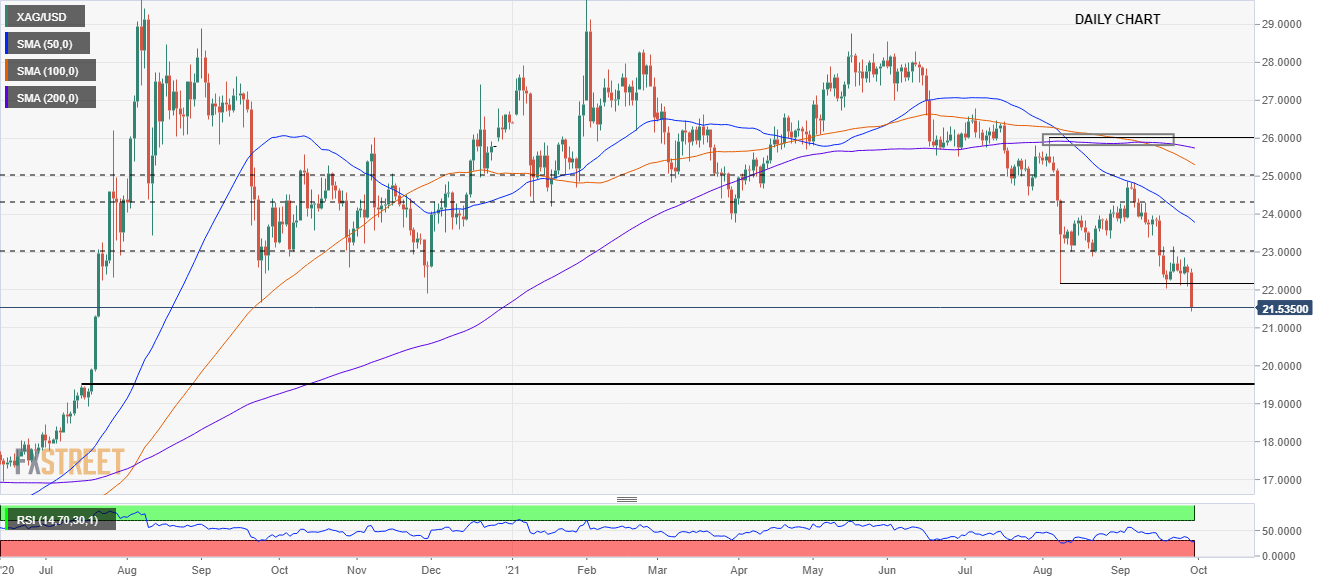
XAG/USD Price Forecast: Technical outlook

Daily chart.

XAG/USD is testing the low of September 24, 2020, at $21.65. A sustained break of the latter would exert substantial downward pressure on silver. The following support level would be July 15, 2020, high at $19.48. In case of a break of that level, the psychological $19.00 would be the seller's next target.

On the flip side, failure at $21.65 can pave the way for further gains. The first supply zone for XAG/USD would be the psychological $22.00 level, immediately followed by the August 9 low at $22.17. A decisive break of the level mentioned above could push the price towards $23.00.

The Relative Strength Index is at 28, in oversold levels, which could signal XAG/USD consolidation ahead. 

ADDITIONAL LEVELS TO WATCH

XAG/USD

Overview
Today last price 21.54
Today Daily Change -0.91
Today Daily Change % -4.05
Today daily open 22.45
 
Trends
Daily SMA20 23.39
Daily SMA50 23.93
Daily SMA100 25.41
Daily SMA200 25.78
 
Levels
Previous Daily High 22.67
Previous Daily Low 22.1
Previous Weekly High 23.15
Previous Weekly Low 22.04
Previous Monthly High 26
Previous Monthly Low 22.17
Daily Fibonacci 38.2% 22.32
Daily Fibonacci 61.8% 22.45
Daily Pivot Point S1 22.15
Daily Pivot Point S2 21.84
Daily Pivot Point S3 21.58
Daily Pivot Point R1 22.72
Daily Pivot Point R2 22.98
Daily Pivot Point R3 23.28


Share: Feed news

Information on these pages contains forward-looking statements that involve risks and uncertainties. Markets and instruments profiled on this page are for informational purposes only and should not in any way come across as a recommendation to buy or sell in these assets. You should do your own thorough research before making any investment decisions. FXStreet does not in any way guarantee that this information is free from mistakes, errors, or material misstatements. It also does not guarantee that this information is of a timely nature. Investing in Open Markets involves a great deal of risk, including the loss of all or a portion of your investment, as well as emotional distress. All risks, losses and costs associated with investing, including total loss of principal, are your responsibility. The views and opinions expressed in this article are those of the authors and do not necessarily reflect the official policy or position of FXStreet nor its advertisers. The author will not be held responsible for information that is found at the end of links posted on this page.

If not otherwise explicitly mentioned in the body of the article, at the time of writing, the author has no position in any stock mentioned in this article and no business relationship with any company mentioned. The author has not received compensation for writing this article, other than from FXStreet.

FXStreet and the author do not provide personalized recommendations. The author makes no representations as to the accuracy, completeness, or suitability of this information. FXStreet and the author will not be liable for any errors, omissions or any losses, injuries or damages arising from this information and its display or use. Errors and omissions excepted.

The author and FXStreet are not registered investment advisors and nothing in this article is intended to be investment advice.

Recommended content


Recommended content

Editors’ Picks

EUR/USD rises toward 1.0700 after Germany and EU PMI data

EUR/USD rises toward 1.0700 after Germany and EU PMI data

EUR/USD gains traction and rises toward 1.0700 in the European session on Monday. HCOB Composite PMI data from Germany and the Eurozone came in better than expected, providing a boost to the Euro. Focus shifts US PMI readings.

EUR/USD News

GBP/USD holds above 1.2350 after UK PMIs

GBP/USD holds above 1.2350 after UK PMIs

GBP/USD clings to modest daily gains above 1.2350 in the European session on Tuesday. The data from the UK showed that the private sector continued to grow at an accelerating pace in April, helping Pound Sterling gather strength.

GBP/USD News

Gold price flirts with $2,300 amid receding safe-haven demand, reduced Fed rate cut bets

Gold price flirts with $2,300 amid receding safe-haven demand, reduced Fed rate cut bets

Gold price (XAU/USD) remains under heavy selling pressure for the second straight day on Tuesday and languishes near its lowest level in over two weeks, around the $2,300 mark heading into the European session.

Gold News

Here’s why Ondo price hit new ATH amid bearish market outlook Premium

Here’s why Ondo price hit new ATH amid bearish market outlook

Ondo price shows no signs of slowing down after setting up an all-time high (ATH) at $1.05 on March 31. This development is likely to be followed by a correction and ATH but not necessarily in that order.

Read more

US S&P Global PMIs Preview: Economic expansion set to keep momentum in April

US S&P Global PMIs Preview: Economic expansion set to keep momentum in April

S&P Global Manufacturing PMI and Services PMI are both expected to come in at 52 in April’s flash estimate, highlighting an ongoing expansion in the private sector’s economic activity.

Read more

Forex MAJORS

Cryptocurrencies

Signatures