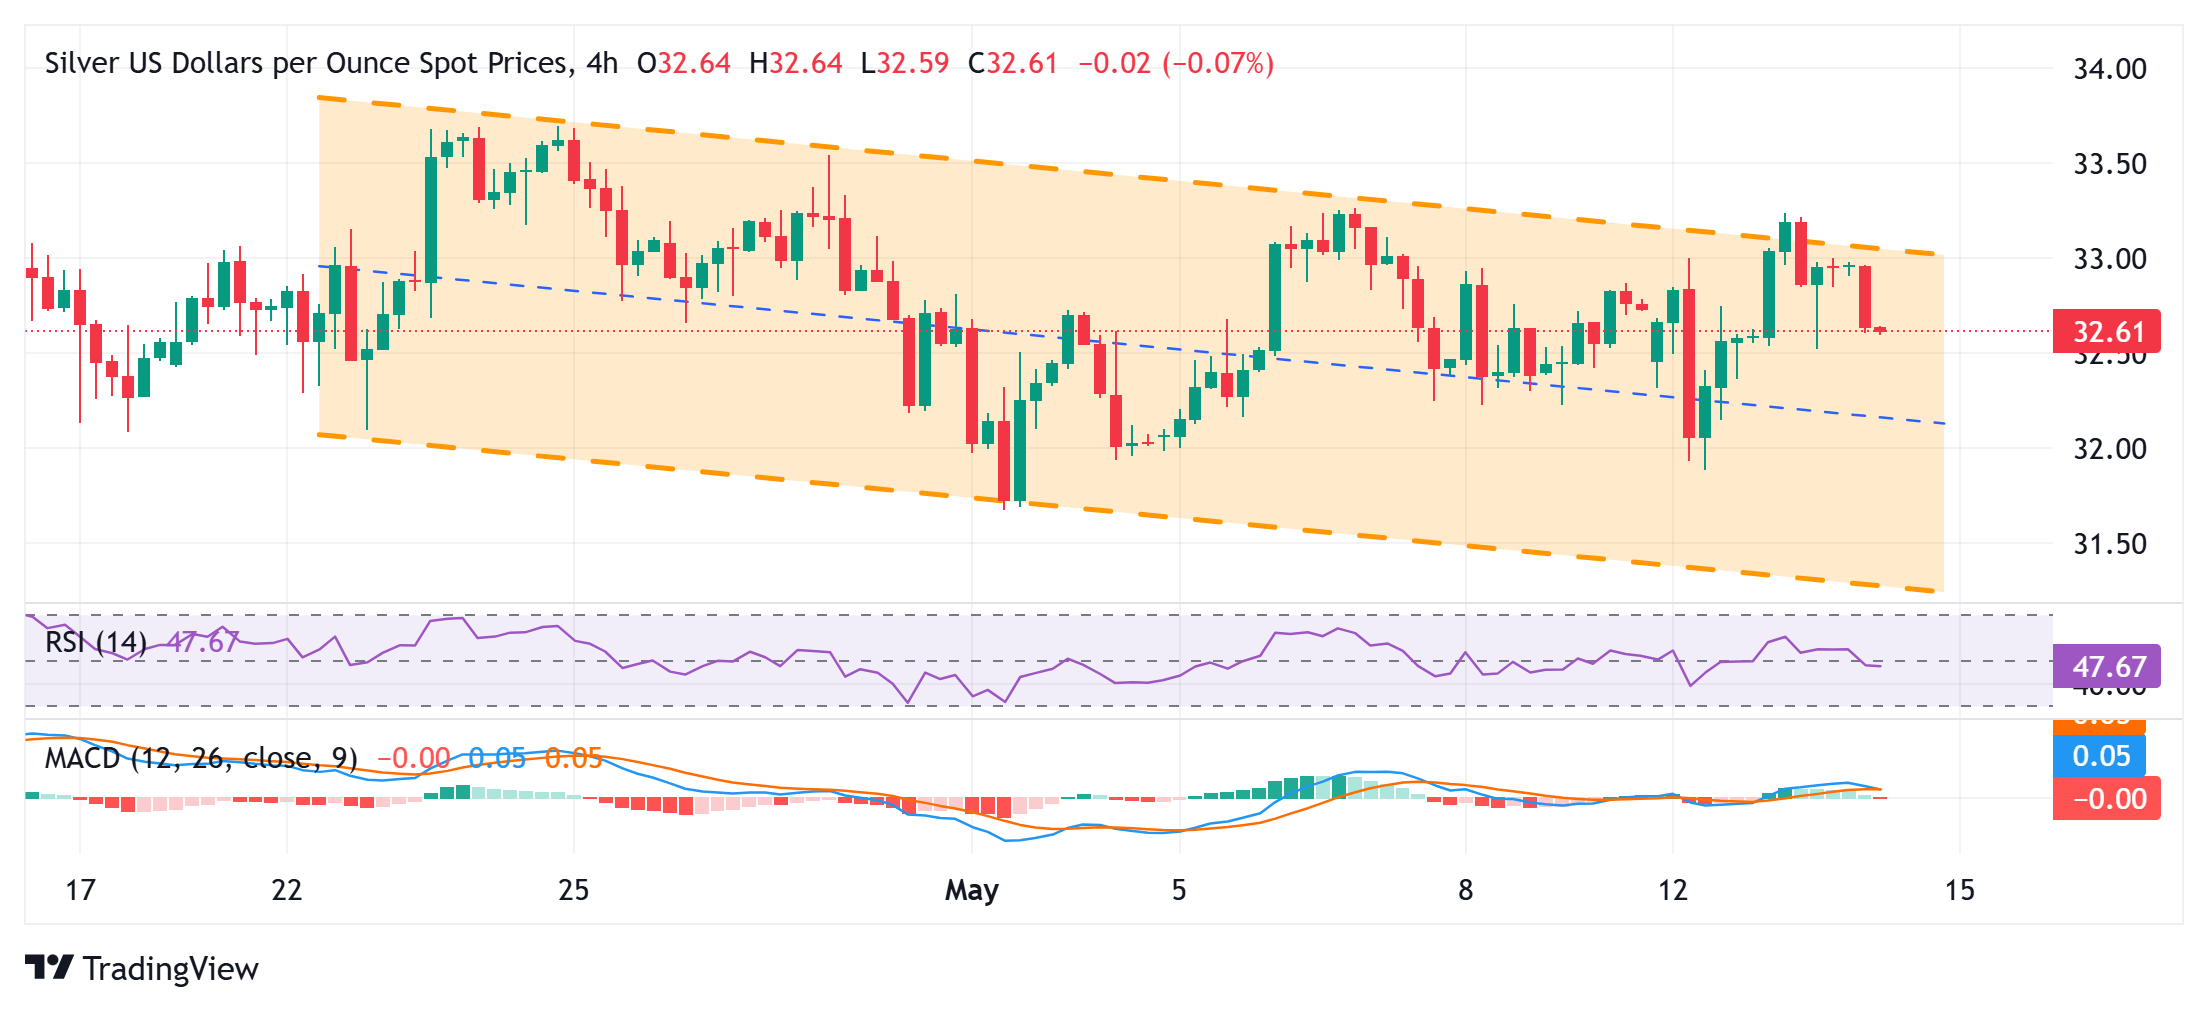
Silver Price Forecast: XAG/USD slides back closer to mid-$31.00s; down nearly 1% for the day
- Silver drifts lower on Wednesday, though the mixed technical setup warrants caution for traders.
- The recent repeated failures to breakout through a descending channel resistance favor bears.
- The formation of a bullish flag pattern supports prospects for the emergence of some dip-buying.

Silver (XAG/USD) extends the previous day's retracement slide from the $33.20-$33.25 resistance zone and attracts some follow-through selling during the Asian session on Wednesday. The white metal drops to a fresh daily low, around the $31.60 area in the last hour, though the mixed technical setup warrants caution before positioning for deeper losses.
Against the backdrop of a goodish recovery from the $28.45 area, or the year-to-date trough touched in April, the recent price action along a three-week-old descending channel constitutes the formation of a bullish flag pattern. However, the overnight failed attempt to breakout through the trend-channel resistance makes it prudent to wait for a sustained move beyond the $33.25 barrier before positioning for any meaningful upside amid slightly negative oscillators on hourly/daily charts.
The XAG/USD might then accelerate the positive move towards the $33.70 intermediate hurdle before aiming to reclaim the $34.00 round-figure mark. Some follow-through buying will set the stage for a further near-term appreciating move towards the March monthly swing high, around the $34.55-$34.60 region.
On the flip side, weakness further below the $32.40 immediate support could make the XAG/USD vulnerable to slide back to sub-$32.00 levels, or the weekly low touched on Monday. This is followed by the $31.70 region, or the monthly low, below which the white metal could aim to challenge the descending channel support, currently pegged around the $31.35 area. A convincing break below the latter will be seen as a key trigger for bears and pave the way for deeper near-term losses.
Silver 4-hour chart
Silver FAQs
Silver is a precious metal highly traded among investors. It has been historically used as a store of value and a medium of exchange. Although less popular than Gold, traders may turn to Silver to diversify their investment portfolio, for its intrinsic value or as a potential hedge during high-inflation periods. Investors can buy physical Silver, in coins or in bars, or trade it through vehicles such as Exchange Traded Funds, which track its price on international markets.
Silver prices can move due to a wide range of factors. Geopolitical instability or fears of a deep recession can make Silver price escalate due to its safe-haven status, although to a lesser extent than Gold's. As a yieldless asset, Silver tends to rise with lower interest rates. Its moves also depend on how the US Dollar (USD) behaves as the asset is priced in dollars (XAG/USD). A strong Dollar tends to keep the price of Silver at bay, whereas a weaker Dollar is likely to propel prices up. Other factors such as investment demand, mining supply – Silver is much more abundant than Gold – and recycling rates can also affect prices.
Silver is widely used in industry, particularly in sectors such as electronics or solar energy, as it has one of the highest electric conductivity of all metals – more than Copper and Gold. A surge in demand can increase prices, while a decline tends to lower them. Dynamics in the US, Chinese and Indian economies can also contribute to price swings: for the US and particularly China, their big industrial sectors use Silver in various processes; in India, consumers’ demand for the precious metal for jewellery also plays a key role in setting prices.
Silver prices tend to follow Gold's moves. When Gold prices rise, Silver typically follows suit, as their status as safe-haven assets is similar. The Gold/Silver ratio, which shows the number of ounces of Silver needed to equal the value of one ounce of Gold, may help to determine the relative valuation between both metals. Some investors may consider a high ratio as an indicator that Silver is undervalued, or Gold is overvalued. On the contrary, a low ratio might suggest that Gold is undervalued relative to Silver.
Author

Haresh Menghani
FXStreet
Haresh Menghani is a detail-oriented professional with 10+ years of extensive experience in analysing the global financial markets.


