Silver Price Forecast: XAG/USD sits near multi-month top, bulls retain control near $34.00 mark
- Silver oscillates in a range near a multi-month high touched on Tuesday.
- The technical setup favors bulls and supports prospects for further gains.
- Any corrective slide could be seen as a buying opportunity near $30.40.

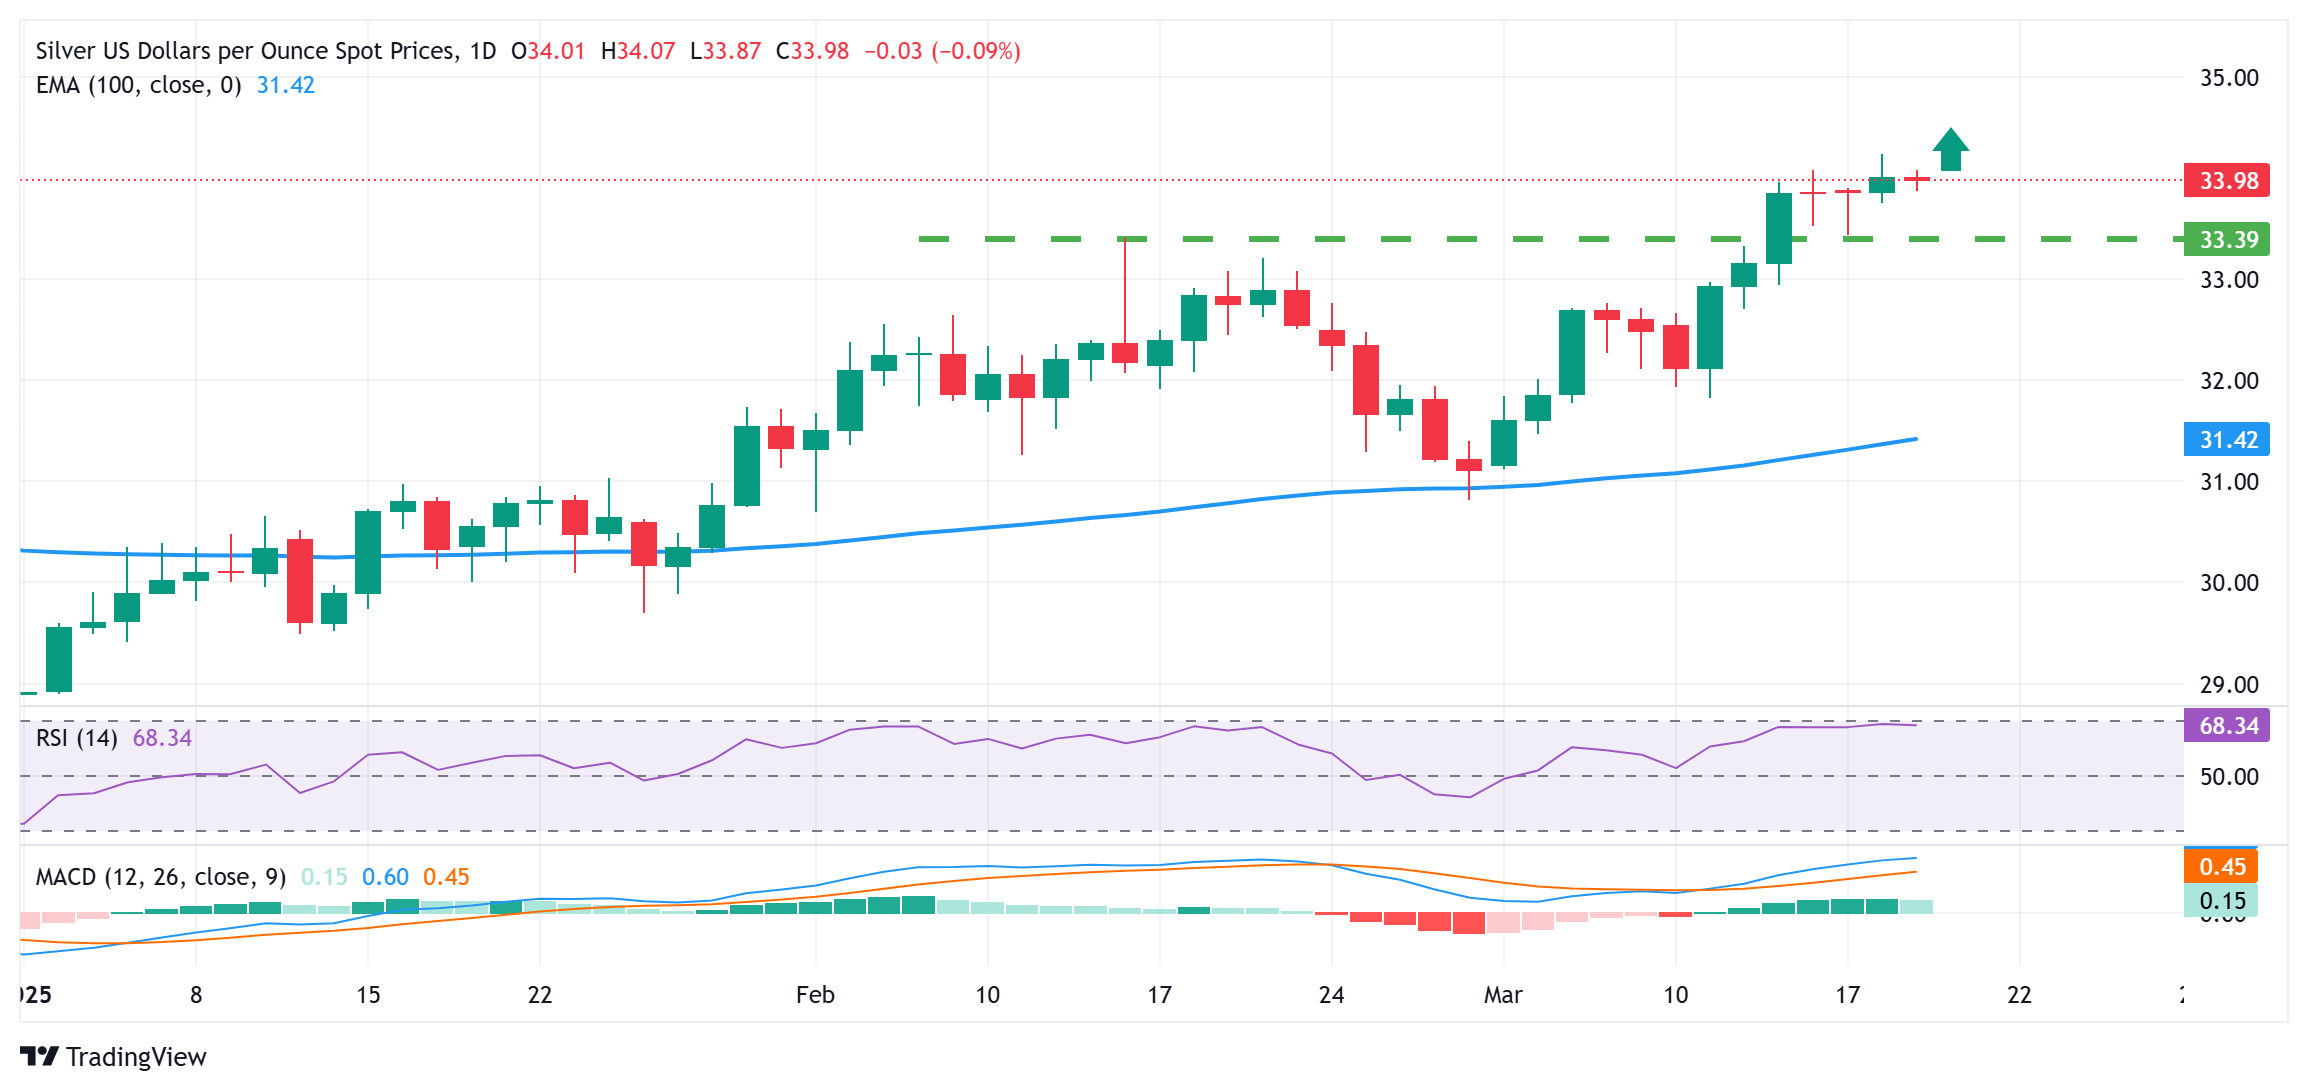
Silver (XAG/USD) consolidates in a range around the $34.00 mark during the Asian session on Wednesday and remains close to its highest level since late October touched the previous day. The technical setup, meanwhile, seems tilted in favor of bulls and suggests that the path of least resistance for the white metal remains to the upside.
This week's bounce from the $33.40 resistance-turned support, along with positive oscillators on the daily chart, validates the constructive outlook and supports prospects for an extension of a nearly three-week-old uptrend. Some follow-through buying beyond the overnight swing high, around the $34.20-$34.25 region, will reaffirm the positive bias and lift the XAG/USD beyond the $34.50-$34.55 intermediate hurdle, towards the $35.00 neighborhood, or a multi-year high touched in October.
On the flip side, any corrective pullback might continue to find some support near the $33.40 region, below which the XAG/USD could accelerate the fall toward the $33.00 round figure. A convincing break below the latter could pave the way for a fall towards the 100-day Exponential Moving Average (EMA) pivotal support, currently pegged near the $31.50-$31.45 zone. This is followed by the $31.25-$31.20 support, the $31.00 mark, and the late February low, around the $30.80 area.
Failure to defend the said support levels might shift the near-term bias in favor of bearish traders and make the XAG/USD vulnerable to accelerate the downfall towards the $30.45-$30.40 support en route to the $30.00 psychological mark. The white metal could eventually drop to the $29.55-$29.50 support and test sub-$29.00 levels, or the year-to-date low touched in January.
XAG/USD daily chart
Silver FAQs
Silver is a precious metal highly traded among investors. It has been historically used as a store of value and a medium of exchange. Although less popular than Gold, traders may turn to Silver to diversify their investment portfolio, for its intrinsic value or as a potential hedge during high-inflation periods. Investors can buy physical Silver, in coins or in bars, or trade it through vehicles such as Exchange Traded Funds, which track its price on international markets.
Silver prices can move due to a wide range of factors. Geopolitical instability or fears of a deep recession can make Silver price escalate due to its safe-haven status, although to a lesser extent than Gold's. As a yieldless asset, Silver tends to rise with lower interest rates. Its moves also depend on how the US Dollar (USD) behaves as the asset is priced in dollars (XAG/USD). A strong Dollar tends to keep the price of Silver at bay, whereas a weaker Dollar is likely to propel prices up. Other factors such as investment demand, mining supply – Silver is much more abundant than Gold – and recycling rates can also affect prices.
Silver is widely used in industry, particularly in sectors such as electronics or solar energy, as it has one of the highest electric conductivity of all metals – more than Copper and Gold. A surge in demand can increase prices, while a decline tends to lower them. Dynamics in the US, Chinese and Indian economies can also contribute to price swings: for the US and particularly China, their big industrial sectors use Silver in various processes; in India, consumers’ demand for the precious metal for jewellery also plays a key role in setting prices.
Silver prices tend to follow Gold's moves. When Gold prices rise, Silver typically follows suit, as their status as safe-haven assets is similar. The Gold/Silver ratio, which shows the number of ounces of Silver needed to equal the value of one ounce of Gold, may help to determine the relative valuation between both metals. Some investors may consider a high ratio as an indicator that Silver is undervalued, or Gold is overvalued. On the contrary, a low ratio might suggest that Gold is undervalued relative to Silver.
Author

Haresh Menghani
FXStreet
Haresh Menghani is a detail-oriented professional with 10+ years of extensive experience in analysing the global financial markets.


