Silver Price Forecast: XAG/USD seems vulnerable below $32.00; 100-day SMA holds the key
- Silver remains below $32.00 on Thursday and close to a two-week low touched on Tuesday.
- The technical setup seems tilted in favor of bears and supports prospects for further losses.
- A sustained break below the 100-day SMA support is needed to reaffirm the negative bias.

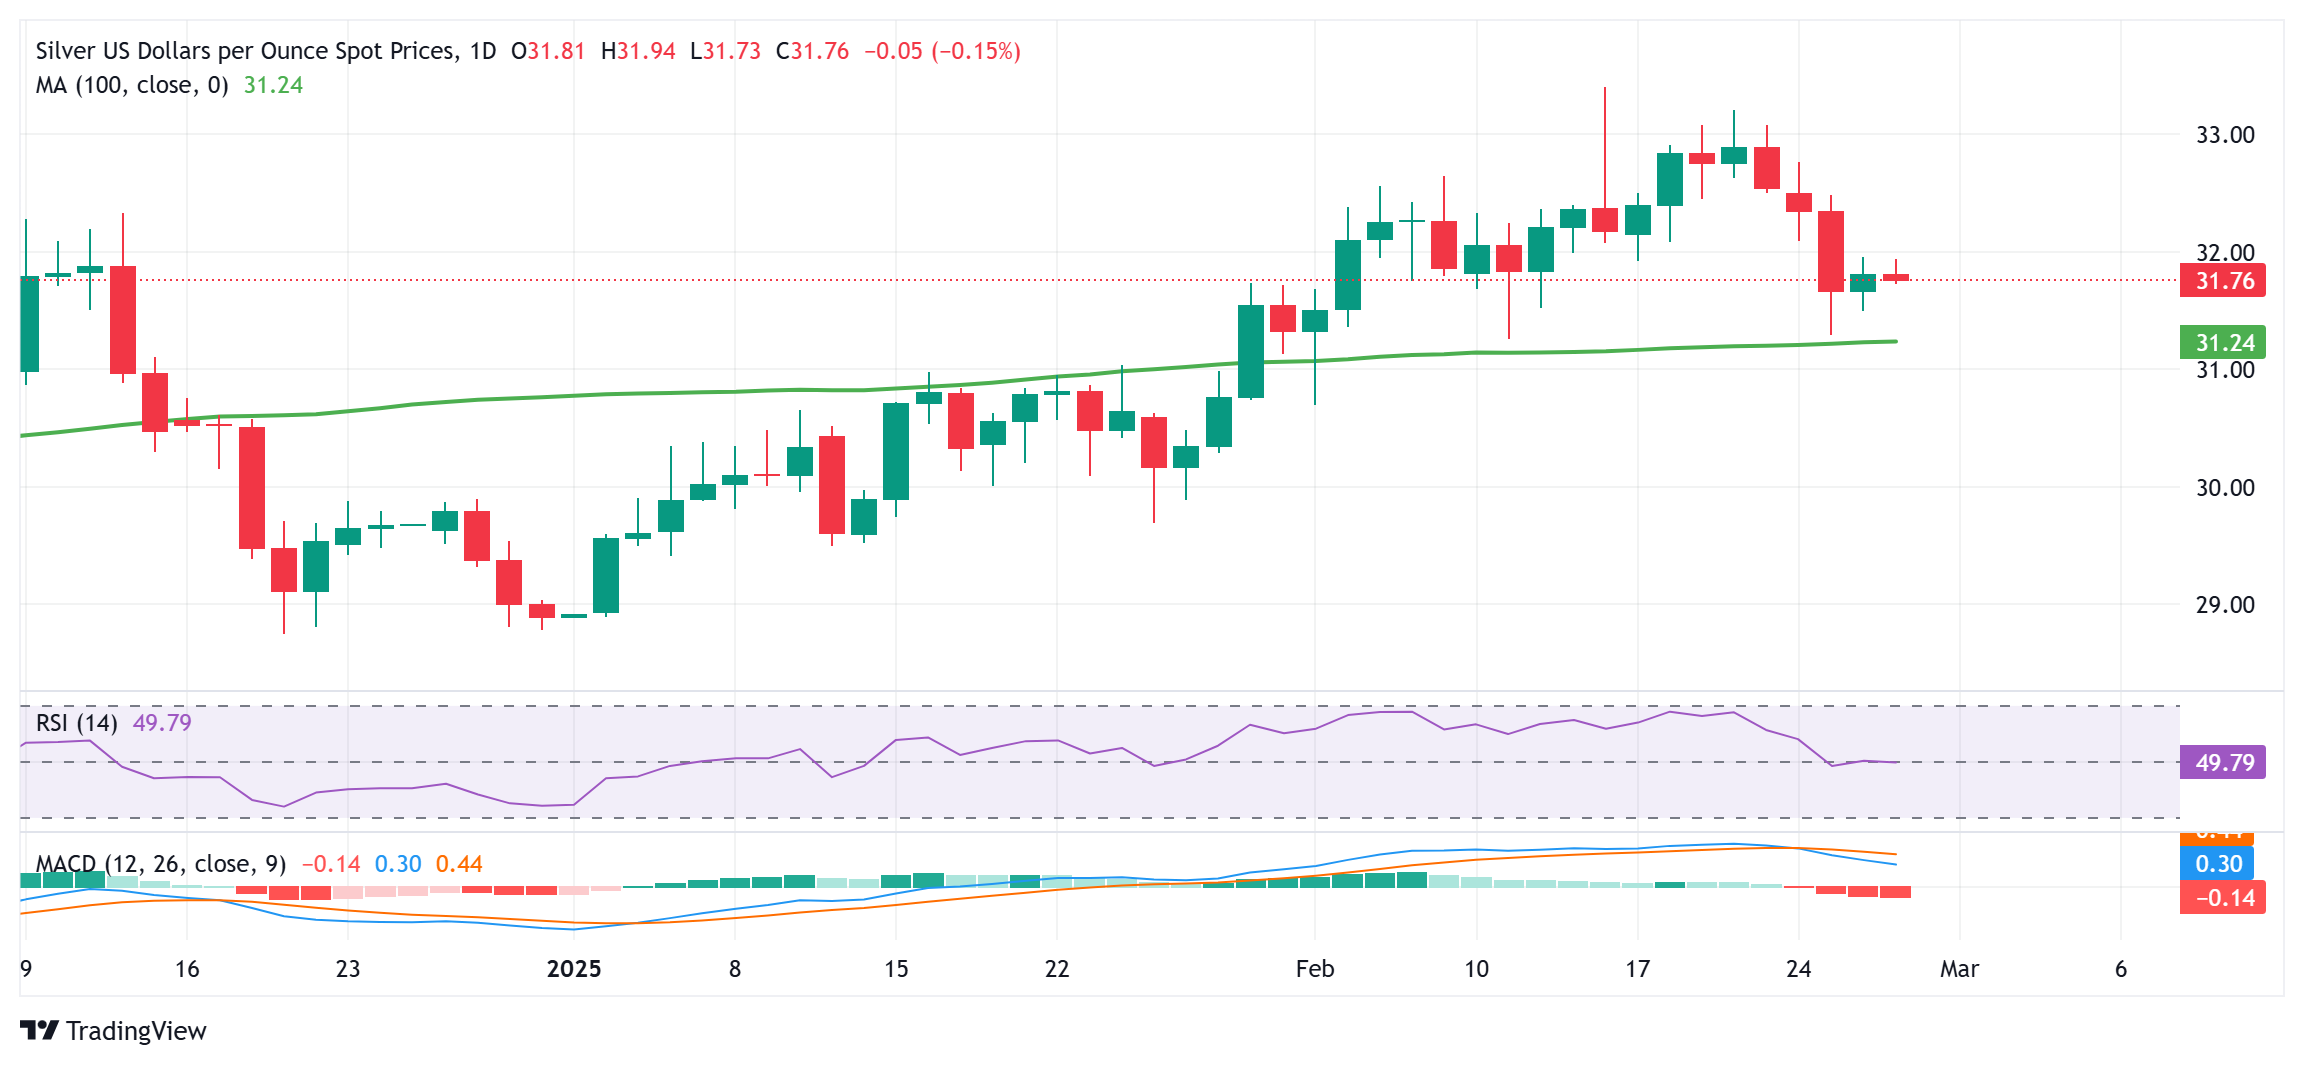
Silver (XAG/USD) struggles to capitalize on the previous day's modest gains and oscillates in a narrow trading band, below the $32.00 round-figure mark during the Asian session on Thursday. The white metal, meanwhile, holds above the 100-day Simple Moving Average (SMA) pivotal support, currently pegged near the $31.30-$31.25 zone, or a two-week low touched on Tuesday.
From a technical perspective, the recent repeated failures to find acceptance above the $33.00 mark and the subsequent downfall favor bearish traders. Moreover, oscillators on the daily chart have just started gaining negative traction and support prospects for an extension of a one-week-old downtrend. The XAG/USD might then weaken further below the $31.00 round-figure mark, towards testing the next relevant support near the $30.25 region.
The downward trajectory could extend further towards the $30.00 psychological mark. A convincing break below the latter will suggest that the XAG/USD has topped out in the near term and pave the way for a further depreciating move towards the $29.55-$29.50 horizontal zone en route to the $29.00 round figure and December 2024 swing low, around the $28.80-$28.75 area.
On the flip side, any positive move beyond the $32.00 mark is likely to confront some resistance near the $32.40-$32.45 region. Some follow-through buying should allow the XAG/USD to make a fresh attempt toward conquering the $33.00 round figure. A sustained strength beyond the latter could lift the commodity towards the monthly swing high, around the $33.40 area touched on February 14, and aim towards reclaiming the $34.00 mark.
Silver FAQs
Silver is a precious metal highly traded among investors. It has been historically used as a store of value and a medium of exchange. Although less popular than Gold, traders may turn to Silver to diversify their investment portfolio, for its intrinsic value or as a potential hedge during high-inflation periods. Investors can buy physical Silver, in coins or in bars, or trade it through vehicles such as Exchange Traded Funds, which track its price on international markets.
Silver prices can move due to a wide range of factors. Geopolitical instability or fears of a deep recession can make Silver price escalate due to its safe-haven status, although to a lesser extent than Gold's. As a yieldless asset, Silver tends to rise with lower interest rates. Its moves also depend on how the US Dollar (USD) behaves as the asset is priced in dollars (XAG/USD). A strong Dollar tends to keep the price of Silver at bay, whereas a weaker Dollar is likely to propel prices up. Other factors such as investment demand, mining supply – Silver is much more abundant than Gold – and recycling rates can also affect prices.
Silver is widely used in industry, particularly in sectors such as electronics or solar energy, as it has one of the highest electric conductivity of all metals – more than Copper and Gold. A surge in demand can increase prices, while a decline tends to lower them. Dynamics in the US, Chinese and Indian economies can also contribute to price swings: for the US and particularly China, their big industrial sectors use Silver in various processes; in India, consumers’ demand for the precious metal for jewellery also plays a key role in setting prices.
Silver prices tend to follow Gold's moves. When Gold prices rise, Silver typically follows suit, as their status as safe-haven assets is similar. The Gold/Silver ratio, which shows the number of ounces of Silver needed to equal the value of one ounce of Gold, may help to determine the relative valuation between both metals. Some investors may consider a high ratio as an indicator that Silver is undervalued, or Gold is overvalued. On the contrary, a low ratio might suggest that Gold is undervalued relative to Silver.
Author

Haresh Menghani
FXStreet
Haresh Menghani is a detail-oriented professional with 10+ years of extensive experience in analysing the global financial markets.


