Silver Price Forecast: XAG/USD rises to near $33.30, capitalizes on US-China trade uncertainty
- Silver price gains to near $33.30 amid uncertainty over US-China trade relations.
- US Bessent has stated that China should initiate trade discussions with them.
- Investors await the US JOLTS Job Openings data for March.

Silver price (XAG/USD) trades higher to near $33.30 during European trading hours on Tuesday. The white metal gains as investors start doubting whether de-escalation in the trade war between the United States (US) and China is underway.
A fresh boost in uncertainty over US-China trade relations has come from comments by US Treasury Secretary Scott Bessent stating that Beijing should be the one to commence trade talks. “I believe that it’s up to China to de-escalate, because they sell five times more to us than we sell to them, Bessent said in an interview on CNBC’s Squawk Box on Monday. However, Bessent indicated that trade discussions with other nations are going well.
Though Bessent’s comments have indicated that the trade war will be majorly between Washington and Beijing, the stand-off is expected to keep global economic tensions heightened. Theoretically, the Silver price performs strongly when fears of global economic turmoil escalate.
Meanwhile, the US Dollar (USD) rises ahead of the US JOLTS Job Openings data for March, which will be published at 14:00 GMT. The US Dollar Index (DXY), which tracks the Greenback’s value against six major currencies, move higher to near 99.30. Investors expect US employers to have posted 7.5 million jobs, marginally lower than 7.56 million seen in February.
This week, investors will pay close attention to a slew of US economic data, including the Nonfarm Payrolls (NFP), which will influence market expectations for the Federal Reserve’s (Fed) monetary policy outlook.
Silver technical analysis
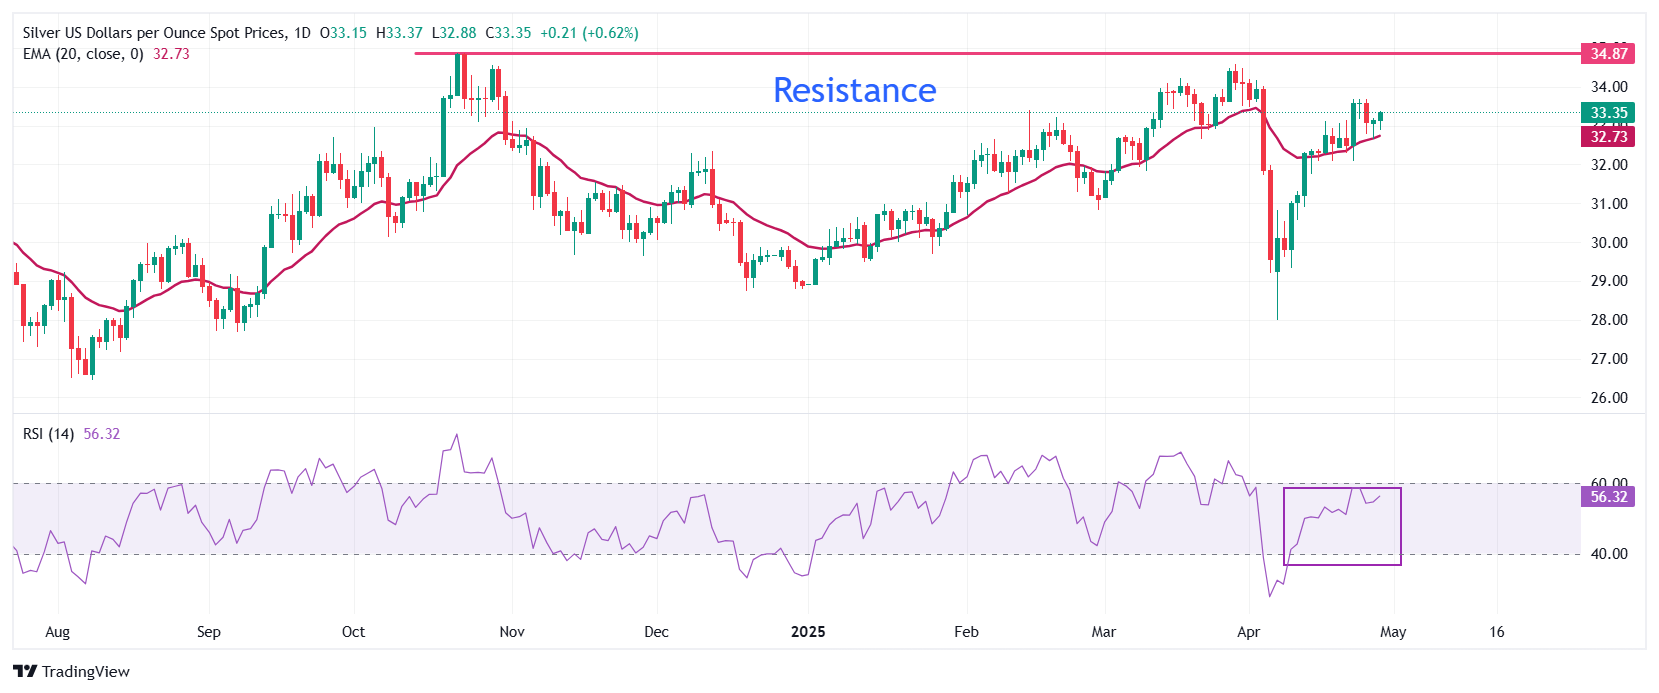
Silver price aims to revisit an over three-week high around $33.70. The near-term outlook of the white metal remains bullish as it holds the 20-day Exponential Moving Average (EMA), which trades around $32.73.
The 14-day Relative Strength Index (RSI) struggles to break above 60.00. A fresh bullish momentum would emerge if the RSI breaks above that level.
Looking up, the March 28 high of $34.60 will act as key resistance for the metal. On the downside, the April 11 low of $30.90 will be the key support zone.
Silver daily chart
Silver FAQs
Silver is a precious metal highly traded among investors. It has been historically used as a store of value and a medium of exchange. Although less popular than Gold, traders may turn to Silver to diversify their investment portfolio, for its intrinsic value or as a potential hedge during high-inflation periods. Investors can buy physical Silver, in coins or in bars, or trade it through vehicles such as Exchange Traded Funds, which track its price on international markets.
Silver prices can move due to a wide range of factors. Geopolitical instability or fears of a deep recession can make Silver price escalate due to its safe-haven status, although to a lesser extent than Gold's. As a yieldless asset, Silver tends to rise with lower interest rates. Its moves also depend on how the US Dollar (USD) behaves as the asset is priced in dollars (XAG/USD). A strong Dollar tends to keep the price of Silver at bay, whereas a weaker Dollar is likely to propel prices up. Other factors such as investment demand, mining supply – Silver is much more abundant than Gold – and recycling rates can also affect prices.
Silver is widely used in industry, particularly in sectors such as electronics or solar energy, as it has one of the highest electric conductivity of all metals – more than Copper and Gold. A surge in demand can increase prices, while a decline tends to lower them. Dynamics in the US, Chinese and Indian economies can also contribute to price swings: for the US and particularly China, their big industrial sectors use Silver in various processes; in India, consumers’ demand for the precious metal for jewellery also plays a key role in setting prices.
Silver prices tend to follow Gold's moves. When Gold prices rise, Silver typically follows suit, as their status as safe-haven assets is similar. The Gold/Silver ratio, which shows the number of ounces of Silver needed to equal the value of one ounce of Gold, may help to determine the relative valuation between both metals. Some investors may consider a high ratio as an indicator that Silver is undervalued, or Gold is overvalued. On the contrary, a low ratio might suggest that Gold is undervalued relative to Silver.
Author

Sagar Dua
FXStreet
Sagar Dua is associated with the financial markets from his college days. Along with pursuing post-graduation in Commerce in 2014, he started his markets training with chart analysis.


