Silver Price Forecast: XAG/USD refreshes multi-year top, looks to build on strength above $34.00
- Silver gains some follow-through traction on Monday and jumps to a fresh 12-year top.
- A slightly overbought RSI on the daily chart warrants some caution for bullish traders.
- Any meaningful corrective slide is more likely to get bought into and remain limited.

Silver (XAG/USD) advances to its highest level since October 2012 during the first half of the European session on Monday, with bulls now looking to extend the upward trajectory beyond the $34.00 round-figure mark.
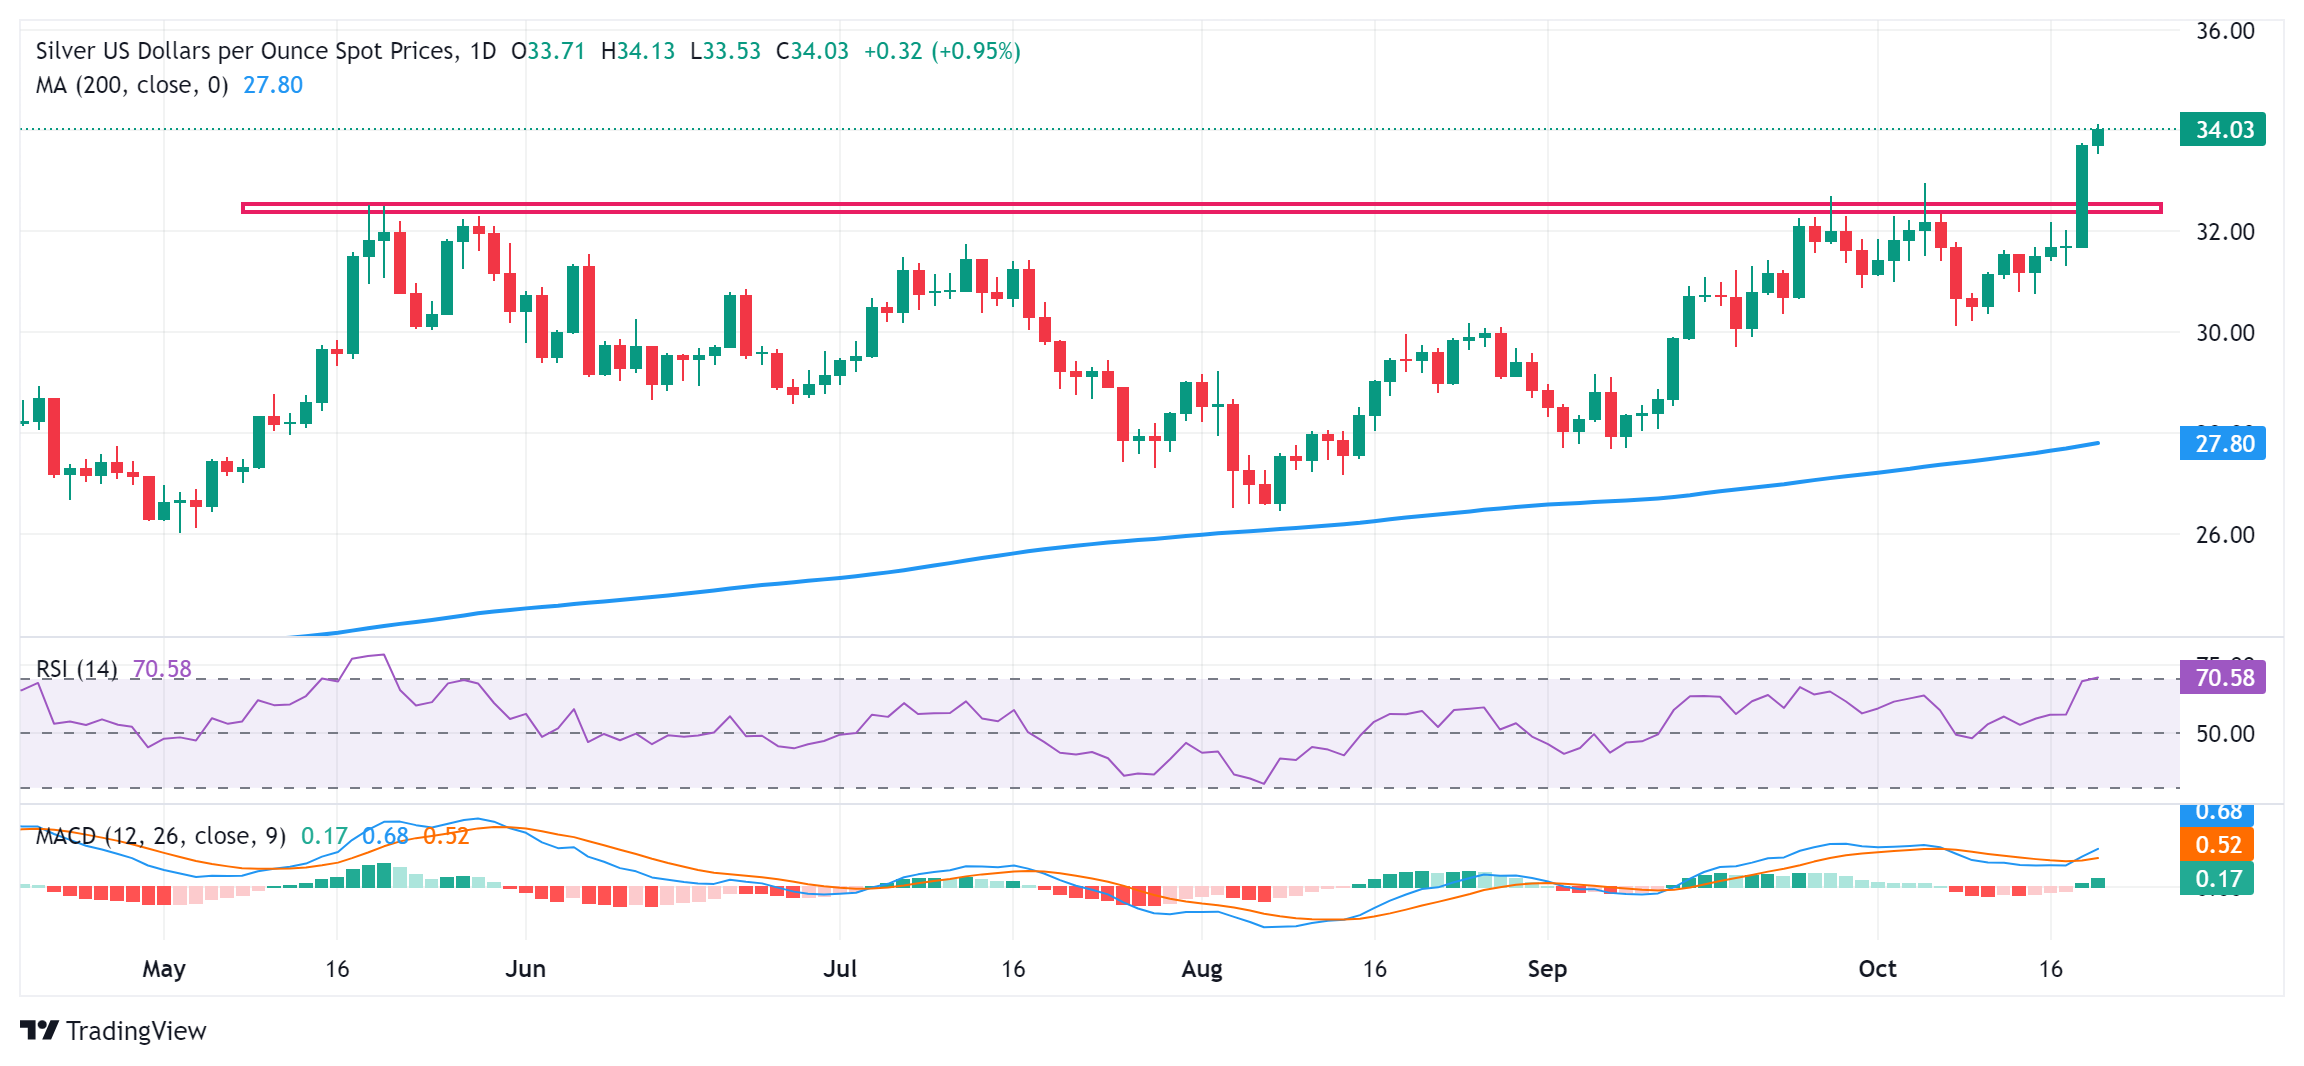
Looking at the broader picture, Friday's sustained breakout above the $32.50 supply zone was seen as a fresh trigger for bullish traders. That said, the Relative Strength Index (RSI) on the daily chart has moved above the 70 mark and points to slightly overbought conditions. This, in turn, makes it prudent to wait for some near-term consolidation or a modest pullback before positioning for any further appreciating move.
Meanwhile, any meaningful corrective decline could be seen as a buying opportunity and remain limited near the $33.00 round figure. A convincing break below, however, might prompt some technical selling and drag the XAG/USD back towards the $32.50 resistance breakpoint, now turned support, en route to the $32.00 mark. The latter should act as a key pivotal point, which if broken might shift the bias in favor of bearish traders.
On the flip side, the immediate hurdle is pegged near the $33.45 horizontal zone, above which the XAG/USD could aim to reclaim the $35.00 psychological mark. The momentum could get extended further towards the October 2012 swing high, around the $35.35-$35.40 region, though the technical setup warrants some caution for bullish traders.
Silver daily chart
Silver FAQs
Silver is a precious metal highly traded among investors. It has been historically used as a store of value and a medium of exchange. Although less popular than Gold, traders may turn to Silver to diversify their investment portfolio, for its intrinsic value or as a potential hedge during high-inflation periods. Investors can buy physical Silver, in coins or in bars, or trade it through vehicles such as Exchange Traded Funds, which track its price on international markets.
Silver prices can move due to a wide range of factors. Geopolitical instability or fears of a deep recession can make Silver price escalate due to its safe-haven status, although to a lesser extent than Gold's. As a yieldless asset, Silver tends to rise with lower interest rates. Its moves also depend on how the US Dollar (USD) behaves as the asset is priced in dollars (XAG/USD). A strong Dollar tends to keep the price of Silver at bay, whereas a weaker Dollar is likely to propel prices up. Other factors such as investment demand, mining supply – Silver is much more abundant than Gold – and recycling rates can also affect prices.
Silver is widely used in industry, particularly in sectors such as electronics or solar energy, as it has one of the highest electric conductivity of all metals – more than Copper and Gold. A surge in demand can increase prices, while a decline tends to lower them. Dynamics in the US, Chinese and Indian economies can also contribute to price swings: for the US and particularly China, their big industrial sectors use Silver in various processes; in India, consumers’ demand for the precious metal for jewellery also plays a key role in setting prices.
Silver prices tend to follow Gold's moves. When Gold prices rise, Silver typically follows suit, as their status as safe-haven assets is similar. The Gold/Silver ratio, which shows the number of ounces of Silver needed to equal the value of one ounce of Gold, may help to determine the relative valuation between both metals. Some investors may consider a high ratio as an indicator that Silver is undervalued, or Gold is overvalued. On the contrary, a low ratio might suggest that Gold is undervalued relative to Silver.
Author

Haresh Menghani
FXStreet
Haresh Menghani is a detail-oriented professional with 10+ years of extensive experience in analysing the global financial markets.


