Silver Price Forecast: XAG/USD recovery holds above $41.50 as buyers regain momentum
- Silver extends its recovery on Friday after testing support near the $41.50.
- A retest of the 14-year high at $42.97 remains on the radar for bulls.
- RSI has recovered to 57 and MACD is turning positive, signaling strengthening momentum as long as $41.50 holds.

Silver (XAG/USD) extends its recovery on Friday, building on Thursday’s modest rebound after hitting its lowest level in over a week earlier this week. At the time of writing, the white metal is trading around $42.35, stabilizing above key technical levels as buyers attempt to regain control following a pullback from the 14-year high at $42.97.
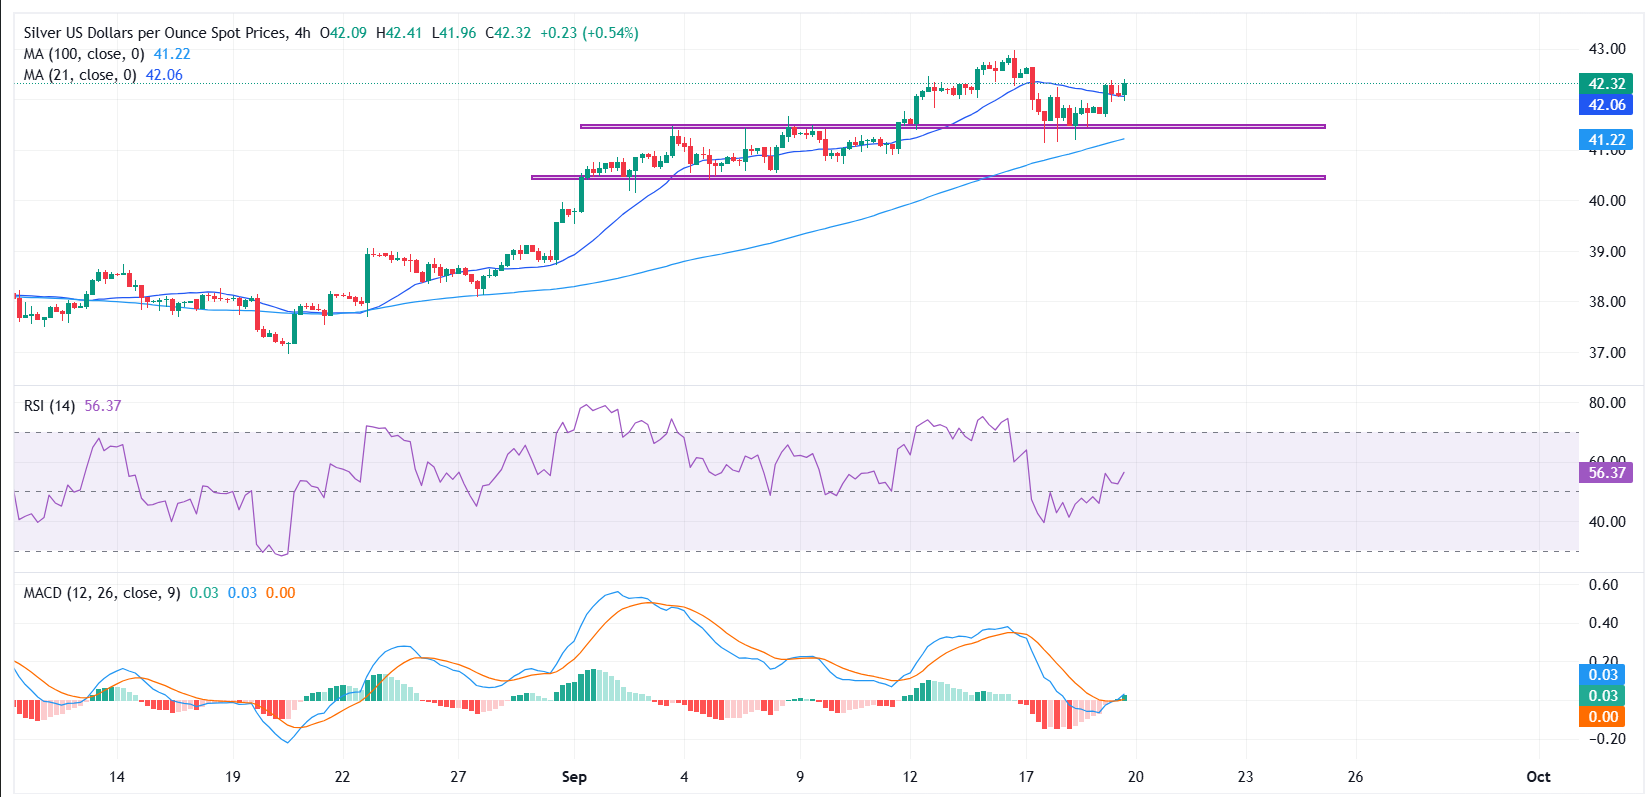
On the 4-hour chart, the $41.50 area — previous breakout zone — has emerged as a key support, reinforced by repeated lower wicks showing dip-buying interest. Price is also holding above the 21-period Simple Moving Average (SMA) at $42.06 and the 100-period SMA at $41.22, keeping the near-term bias constructive. A decisive break below $41.50 would risk exposing the deeper base near $40.50.
On the topside, resistance remains layered, with $42.50 acting as the next hurdle before a potential retest of the recent 14-year high at $42.97. A sustained break above that peak could open the way toward the psychological $43.50 handle, extending the broader uptrend. Until then, price action suggests a consolidation phase with an upward tilt.
Momentum signals are improving. The Relative Strength Index (RSI) has recovered to 57, showing growing bullish momentum without nearing overbought territory. Meanwhile, the MACD histogram is turning positive, with a potential bullish crossover developing. Together, these signals suggest upside pressure could build further as long as Silver holds above the $41.50 support floor.
Silver FAQs
Silver is a precious metal highly traded among investors. It has been historically used as a store of value and a medium of exchange. Although less popular than Gold, traders may turn to Silver to diversify their investment portfolio, for its intrinsic value or as a potential hedge during high-inflation periods. Investors can buy physical Silver, in coins or in bars, or trade it through vehicles such as Exchange Traded Funds, which track its price on international markets.
Silver prices can move due to a wide range of factors. Geopolitical instability or fears of a deep recession can make Silver price escalate due to its safe-haven status, although to a lesser extent than Gold's. As a yieldless asset, Silver tends to rise with lower interest rates. Its moves also depend on how the US Dollar (USD) behaves as the asset is priced in dollars (XAG/USD). A strong Dollar tends to keep the price of Silver at bay, whereas a weaker Dollar is likely to propel prices up. Other factors such as investment demand, mining supply – Silver is much more abundant than Gold – and recycling rates can also affect prices.
Silver is widely used in industry, particularly in sectors such as electronics or solar energy, as it has one of the highest electric conductivity of all metals – more than Copper and Gold. A surge in demand can increase prices, while a decline tends to lower them. Dynamics in the US, Chinese and Indian economies can also contribute to price swings: for the US and particularly China, their big industrial sectors use Silver in various processes; in India, consumers’ demand for the precious metal for jewellery also plays a key role in setting prices.
Silver prices tend to follow Gold's moves. When Gold prices rise, Silver typically follows suit, as their status as safe-haven assets is similar. The Gold/Silver ratio, which shows the number of ounces of Silver needed to equal the value of one ounce of Gold, may help to determine the relative valuation between both metals. Some investors may consider a high ratio as an indicator that Silver is undervalued, or Gold is overvalued. On the contrary, a low ratio might suggest that Gold is undervalued relative to Silver.
Author

Vishal Chaturvedi
FXStreet
I am a macro-focused research analyst with over four years of experience covering forex and commodities market. I enjoy breaking down complex economic trends and turning them into clear, actionable insights that help traders stay ahead of the curve.


