Silver Price Forecast: XAG/USD rallies sharply, posts weekly gains of 3.5%
- XAG/USD up 0.24% on Friday, on track to end week over 3.5% higher.
- Price surged more than 6% since July 31 low at 50-day SMA of $36.20.
- Bullish harami pattern confirmed after breaching July 31 high of $37.26.

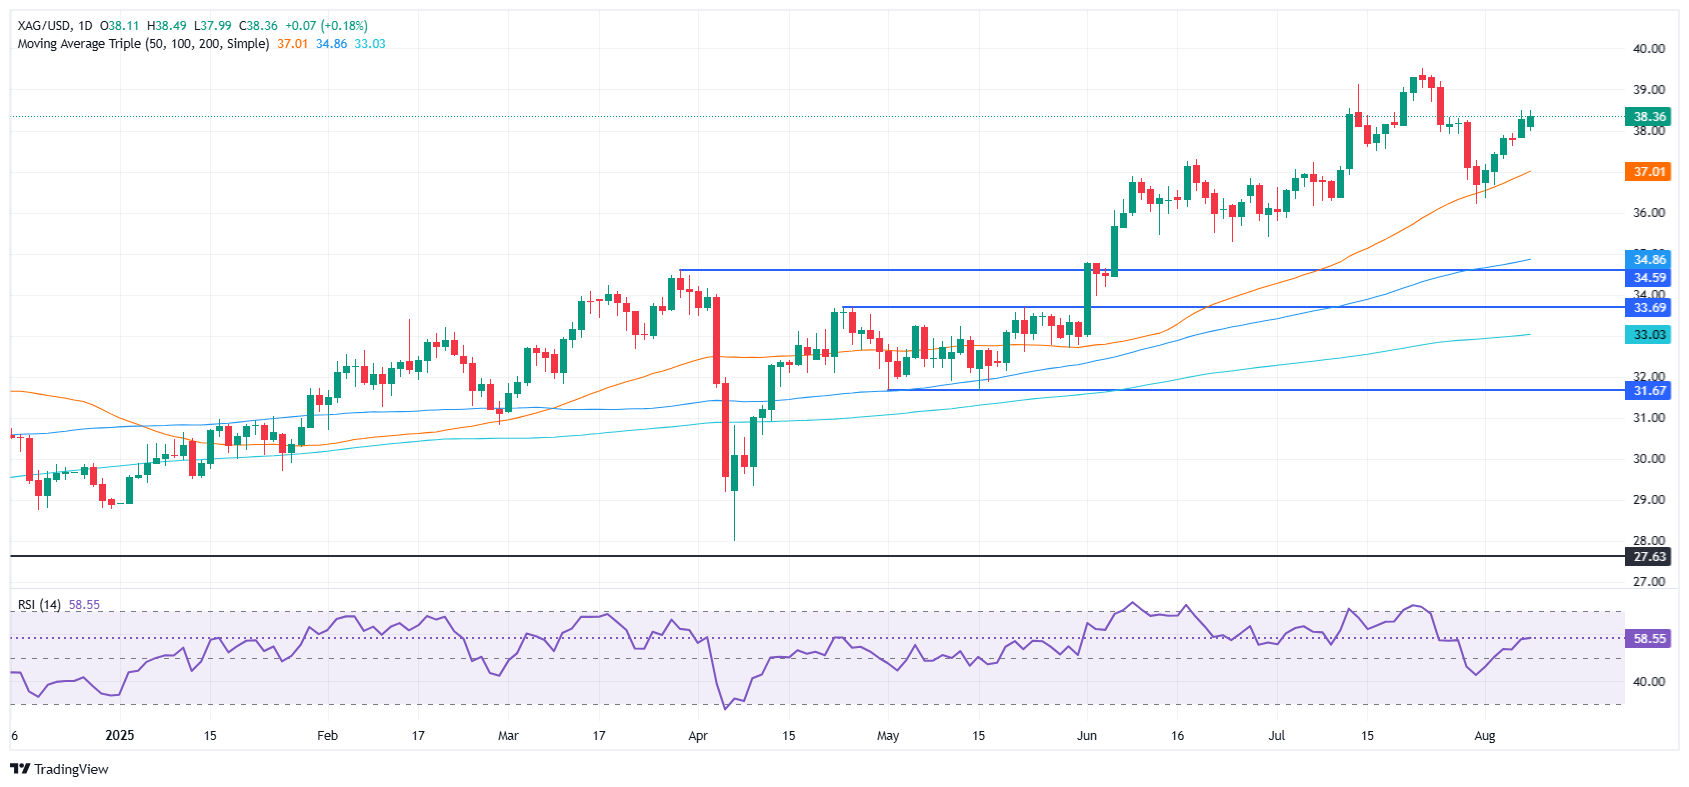
Silver Price advances for the fourth time in the week, poised to end above $38.00 a troy ounce and close to weekly highs of $38.50 as traders prepare for the weekend. Broad US Dollar weakness across the board and increasing bets that the Federal Reserve might reduce rates at the September meeting, supported the grey metal advance.
XAG/USD trades with daily gains of 0.24%, set to end the week up by more than 3.50%.
XAG/USD Price Forecast: Technical outlook
XAG/USD sits $1.50 shy of resting the yearly high after retreating below the 20-day Simple Moving Average (SMA) to test the 50-day SMA at 36.20 on July 31.
Since then, Silver has rallied more than 6%, sparked by the formation of a ‘bullish harami,’ confirmed by the crucial breach of the July 31 high of $37.26. The grey metal climbed sharply and cleared the 20-day SMA at $38.06, further cementing its upward bias.
However, buyers need to breach the $39.00 so they can test the YTD high of $39.52, before challenging $40.00. On the flip side, although momentum is bullish, confirmed by price action and the Relative Strength Index (RSI), traders could not price out a reversal.
If Silver dives below the 20-day SMA and $38.00, then sellers could pile on to push prices toward $37.00, aimed to test the 50-day SMA at $36.85.
XAG/USD Price Chart – Daily
Silver FAQs
Silver is a precious metal highly traded among investors. It has been historically used as a store of value and a medium of exchange. Although less popular than Gold, traders may turn to Silver to diversify their investment portfolio, for its intrinsic value or as a potential hedge during high-inflation periods. Investors can buy physical Silver, in coins or in bars, or trade it through vehicles such as Exchange Traded Funds, which track its price on international markets.
Silver prices can move due to a wide range of factors. Geopolitical instability or fears of a deep recession can make Silver price escalate due to its safe-haven status, although to a lesser extent than Gold's. As a yieldless asset, Silver tends to rise with lower interest rates. Its moves also depend on how the US Dollar (USD) behaves as the asset is priced in dollars (XAG/USD). A strong Dollar tends to keep the price of Silver at bay, whereas a weaker Dollar is likely to propel prices up. Other factors such as investment demand, mining supply – Silver is much more abundant than Gold – and recycling rates can also affect prices.
Silver is widely used in industry, particularly in sectors such as electronics or solar energy, as it has one of the highest electric conductivity of all metals – more than Copper and Gold. A surge in demand can increase prices, while a decline tends to lower them. Dynamics in the US, Chinese and Indian economies can also contribute to price swings: for the US and particularly China, their big industrial sectors use Silver in various processes; in India, consumers’ demand for the precious metal for jewellery also plays a key role in setting prices.
Silver prices tend to follow Gold's moves. When Gold prices rise, Silver typically follows suit, as their status as safe-haven assets is similar. The Gold/Silver ratio, which shows the number of ounces of Silver needed to equal the value of one ounce of Gold, may help to determine the relative valuation between both metals. Some investors may consider a high ratio as an indicator that Silver is undervalued, or Gold is overvalued. On the contrary, a low ratio might suggest that Gold is undervalued relative to Silver.
Author

Christian Borjon Valencia
FXStreet
Markets analyst, news editor, and trading instructor with over 14 years of experience across FX, commodities, US equity indices, and global macro markets.


