Silver Price Forecast: XAG/USD hovers around $33.00 amid weak US Dollar
- Silver holds near $33.00, supported by soft Dollar and improved risk appetite.
- RSI flattens despite bullish tone, suggesting near-term indecision and possible consolidation.
- Break above $33.25 targets $33.68 and $34.00; drop below $32.75 may expose $31.89 and $31.28.

Silver price edged up 0.95% on Tuesday as the Greenback finished the session below the 101.00 figure, according to the US Dollar Index (DXY), which tracks the performance of the buck’s value against a basket of six currencies. At the time of writing, as the Asian session begins, XAG/USD trades at $32.92, registering modest gains near the $33.00 figure.
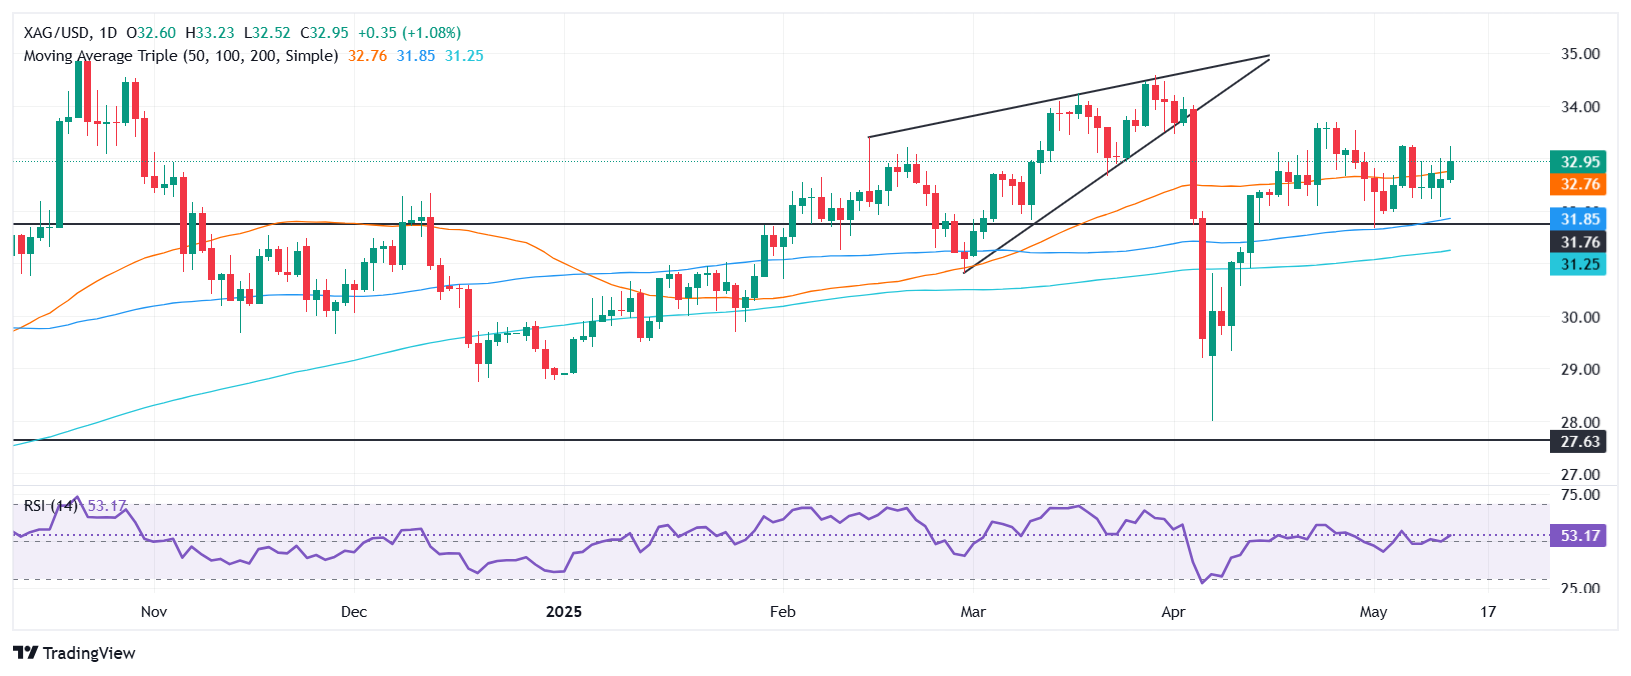
XAG/USD Price Forecast: Technical outlook
The Silver technical outlook suggests that further consolidation lies ahead, with stir resistance found at the psychological $33.00 figure. However, momentum indicators like the Relative Strength Index (RSI), despite remaining bullish, turned flattish as indecision sinks on traders.
For a bullish resumption, buyers need to reclaim $33.00 and clear the latest swing high reached on May 7 at $33.25. Once surpassed, $33.50 emerges as next resistance, followed by the April 28 high of $33.68. A breach of the latter will expose $34.00.
Conversely, if XAG/USD drifts below the 50-day Simple Moving Average (SMA) of $32.75, a move towards the 100-day SMA at $31.89 is likely. On further weakness, the bulls' following line of defense would be the 200-day SMA at $31.28.
XAG/USD Price Chart – Daily
Silver FAQs
Silver is a precious metal highly traded among investors. It has been historically used as a store of value and a medium of exchange. Although less popular than Gold, traders may turn to Silver to diversify their investment portfolio, for its intrinsic value or as a potential hedge during high-inflation periods. Investors can buy physical Silver, in coins or in bars, or trade it through vehicles such as Exchange Traded Funds, which track its price on international markets.
Silver prices can move due to a wide range of factors. Geopolitical instability or fears of a deep recession can make Silver price escalate due to its safe-haven status, although to a lesser extent than Gold's. As a yieldless asset, Silver tends to rise with lower interest rates. Its moves also depend on how the US Dollar (USD) behaves as the asset is priced in dollars (XAG/USD). A strong Dollar tends to keep the price of Silver at bay, whereas a weaker Dollar is likely to propel prices up. Other factors such as investment demand, mining supply – Silver is much more abundant than Gold – and recycling rates can also affect prices.
Silver is widely used in industry, particularly in sectors such as electronics or solar energy, as it has one of the highest electric conductivity of all metals – more than Copper and Gold. A surge in demand can increase prices, while a decline tends to lower them. Dynamics in the US, Chinese and Indian economies can also contribute to price swings: for the US and particularly China, their big industrial sectors use Silver in various processes; in India, consumers’ demand for the precious metal for jewellery also plays a key role in setting prices.
Silver prices tend to follow Gold's moves. When Gold prices rise, Silver typically follows suit, as their status as safe-haven assets is similar. The Gold/Silver ratio, which shows the number of ounces of Silver needed to equal the value of one ounce of Gold, may help to determine the relative valuation between both metals. Some investors may consider a high ratio as an indicator that Silver is undervalued, or Gold is overvalued. On the contrary, a low ratio might suggest that Gold is undervalued relative to Silver.
Author

Christian Borjon Valencia
FXStreet
Markets analyst, news editor, and trading instructor with over 14 years of experience across FX, commodities, US equity indices, and global macro markets.


