Silver Price Forecast: XAG/USD extends rally above $36 on value-buying, US NFP in spotlight
- Silver price rises further to near $36.20, aiming to balance valuation in comparison with Gold.
- Improving Sino-US trade relations fail to limit the Silver’s upside.
- Investors await the US employment data for May for fresh cues on the Fed’s monetary policy outlook.

Silver price (XAG/USD) refreshes over a decade high to near $36.20 on Friday. The white metal performs strongly as market experts quoted it a value buy, citing its secular underperformance in comparison with Gold.
Silver has underperformed gold over a long period of time and looks significantly undervalued. This appears to be attracting investors, analysts at Commerzbank said. They added that the silver market is expected to be in a “supply deficit for the fifth consecutive year”. However, the deficit is expected to be “significantly smaller” as “demand will likely decline and supply to increase”,
On the global economic front, trade worries between the United States (US) and China have eased after a post from President Donald Trump on Truth.Social signaled that he had a direct conversation with Chinese leader XI Jinping and trade talks between the two will be smooth in the future.
“The call lasted approximately one and a half hours, and resulted in a very positive conclusion for both countries.” Trump wrote.
Theoretically, resolving global economic tensions diminish demand for safe-haven assets, such as Silver. However, the demand for Silver as an industrial input will increase, given its application in various sectors, such as mining, Electric Vehicles, and semiconductors, etc.
In Friday’s session, investors will focus on the US Nonfarm Payrolls (NFP) data for May, which will be published at 12:30 GMT. The labor market data will influence market expectations for the Federal Reserve’s (Fed) monetary policy outlook.
Higher interest rates by the Fed for a longer period bodes poorly for non-yielding assets, such as Silver.
Ahead of the US NFP data, the US Dollar Index (DXY), which tracks the Greenback’s value against six major currencies, gains ground and rises to near 99.00.
Silver technical analysis
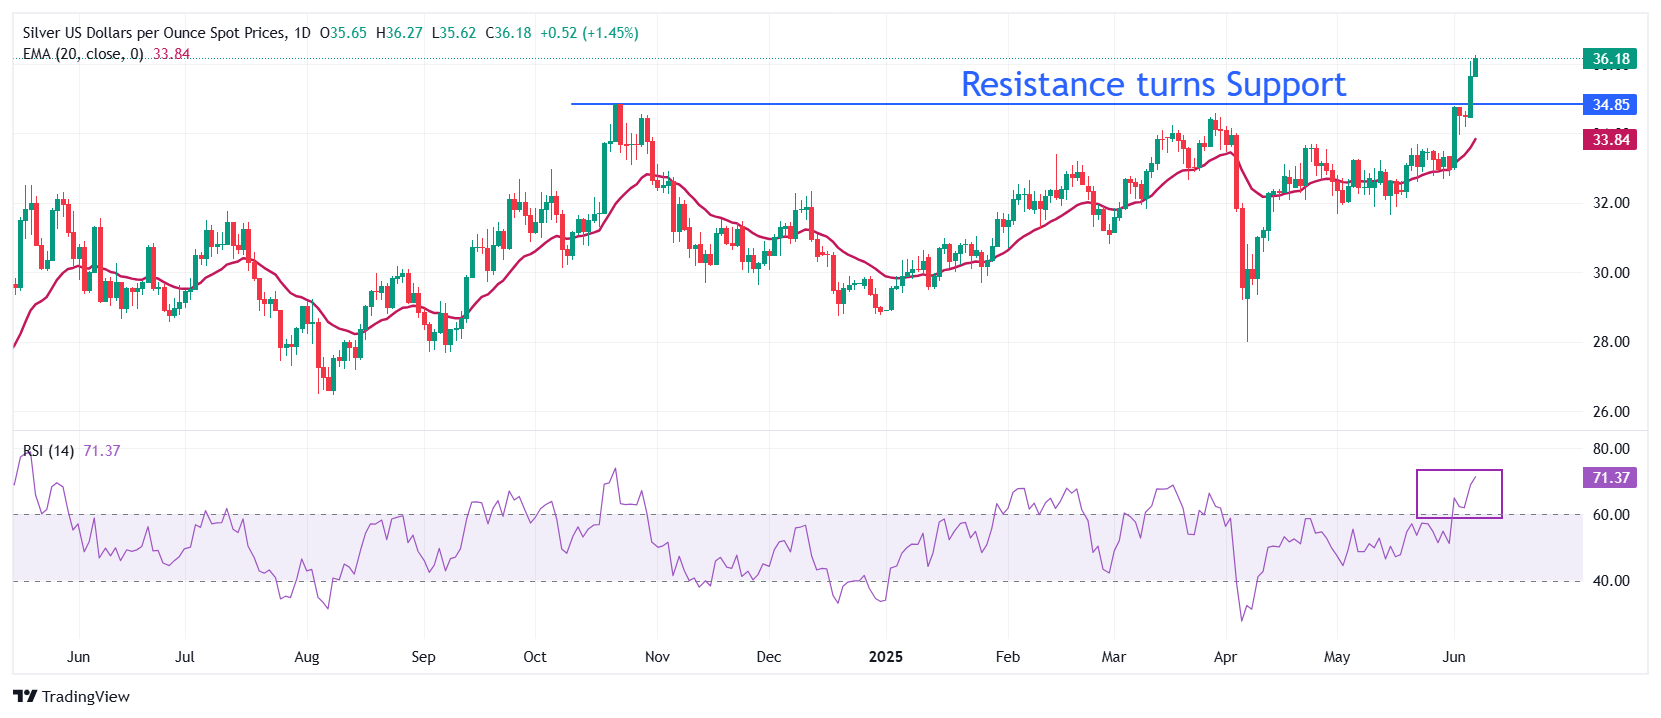
Silver price advances to near $36.20 after breaking above the key resistance plotted from the October 22 high of $34.87, which will act as a key support now. Advancing 20-day Exponential Moving Average (EMA) near $33.85 suggests that the near-term trend is bullish.
The 14-day Relative Strength Index (RSI) jumps above 70.00, indicating a strong bullish momentum.
Looking up, psychological level of $40.00 will be the major resistance for the Silver price. On the downside, the October 22 high of $34.87 will act as key support for the asset.
Silver daily chart
Silver FAQs
Silver is a precious metal highly traded among investors. It has been historically used as a store of value and a medium of exchange. Although less popular than Gold, traders may turn to Silver to diversify their investment portfolio, for its intrinsic value or as a potential hedge during high-inflation periods. Investors can buy physical Silver, in coins or in bars, or trade it through vehicles such as Exchange Traded Funds, which track its price on international markets.
Silver prices can move due to a wide range of factors. Geopolitical instability or fears of a deep recession can make Silver price escalate due to its safe-haven status, although to a lesser extent than Gold's. As a yieldless asset, Silver tends to rise with lower interest rates. Its moves also depend on how the US Dollar (USD) behaves as the asset is priced in dollars (XAG/USD). A strong Dollar tends to keep the price of Silver at bay, whereas a weaker Dollar is likely to propel prices up. Other factors such as investment demand, mining supply – Silver is much more abundant than Gold – and recycling rates can also affect prices.
Silver is widely used in industry, particularly in sectors such as electronics or solar energy, as it has one of the highest electric conductivity of all metals – more than Copper and Gold. A surge in demand can increase prices, while a decline tends to lower them. Dynamics in the US, Chinese and Indian economies can also contribute to price swings: for the US and particularly China, their big industrial sectors use Silver in various processes; in India, consumers’ demand for the precious metal for jewellery also plays a key role in setting prices.
Silver prices tend to follow Gold's moves. When Gold prices rise, Silver typically follows suit, as their status as safe-haven assets is similar. The Gold/Silver ratio, which shows the number of ounces of Silver needed to equal the value of one ounce of Gold, may help to determine the relative valuation between both metals. Some investors may consider a high ratio as an indicator that Silver is undervalued, or Gold is overvalued. On the contrary, a low ratio might suggest that Gold is undervalued relative to Silver.
Author

Sagar Dua
FXStreet
Sagar Dua is associated with the financial markets from his college days. Along with pursuing post-graduation in Commerce in 2014, he started his markets training with chart analysis.


