Silver Price Forecast: XAG/USD dips below 100-day SMA, eyes on $30.00
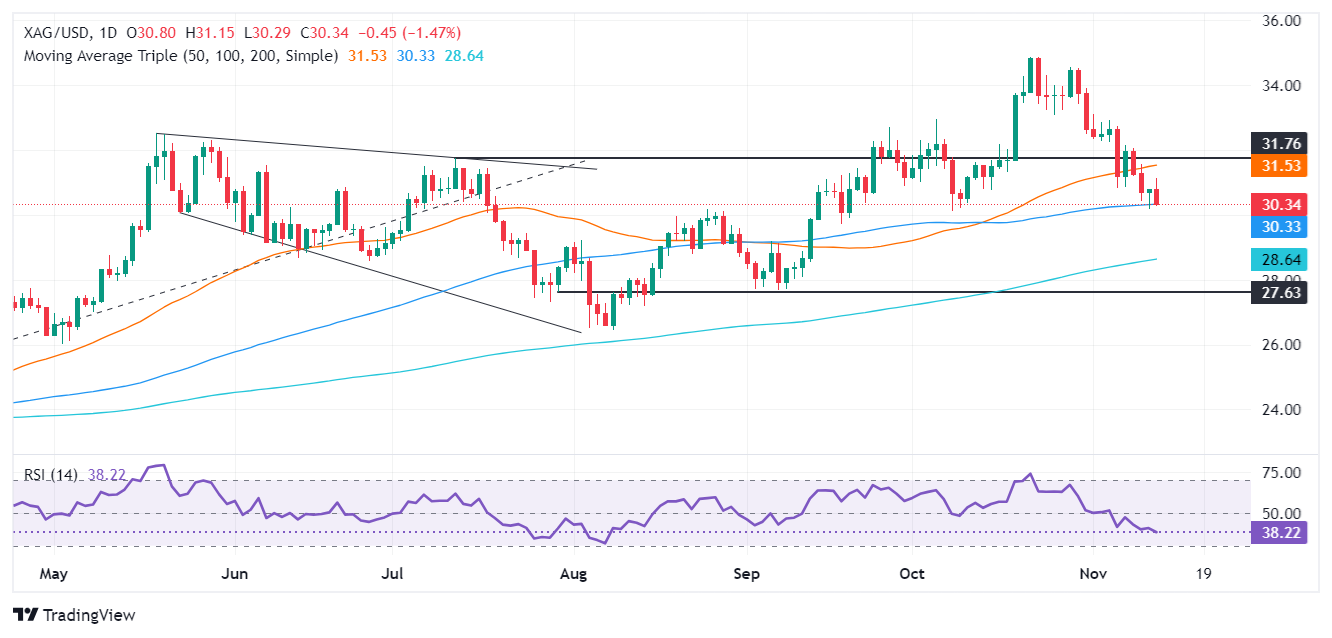
- Silver struggles near 100-day SMA, with downside potential towards $30.00 and lower supports.
- Technical outlook suggests further weakness, with a key support at $30.18 and the 200-day SMA at $28.63 in focus.
- Recovery above $31.00 could challenge resistance at the 50-day SMA and extend towards $32.00.

Silver price drops below $30.50 for the second consecutive session, prints losses of over 0.90% following a tempered US inflation report. The US CPI came as expected, though he hinted that disinflation has stalled. The XAG/USD trades at $30.40, set to end the session lower.
XAG/USD Price Forecast: Technical outlook
Silver price consolidated during the last two days at around the 100-day Simple Moving Average (SMA) at $30.31. However, the mid-term bias is tilted to the downside, and once bears push prices below August’s 26 high turned support at $30.18, they will test the psychological $30.00 mark. A breach of the latter will expose the 200-day SMA at $28.63, followed by the September 6 swing low of $27.69.
If Silver moves back above $31.00, this could pave the way for challenging the 50-day SMA at $31.51. Once surpassed, XAG/USD's next resistance would be $32.00.
Oscillators like the Relative Strength Index (RSI) hint that further XAG/USD’s downside is seen, as RSI remains shy of being oversold.
XAG/USD Price Chart – Daily
Silver FAQs
Silver is a precious metal highly traded among investors. It has been historically used as a store of value and a medium of exchange. Although less popular than Gold, traders may turn to Silver to diversify their investment portfolio, for its intrinsic value or as a potential hedge during high-inflation periods. Investors can buy physical Silver, in coins or in bars, or trade it through vehicles such as Exchange Traded Funds, which track its price on international markets.
Silver prices can move due to a wide range of factors. Geopolitical instability or fears of a deep recession can make Silver price escalate due to its safe-haven status, although to a lesser extent than Gold's. As a yieldless asset, Silver tends to rise with lower interest rates. Its moves also depend on how the US Dollar (USD) behaves as the asset is priced in dollars (XAG/USD). A strong Dollar tends to keep the price of Silver at bay, whereas a weaker Dollar is likely to propel prices up. Other factors such as investment demand, mining supply – Silver is much more abundant than Gold – and recycling rates can also affect prices.
Silver is widely used in industry, particularly in sectors such as electronics or solar energy, as it has one of the highest electric conductivity of all metals – more than Copper and Gold. A surge in demand can increase prices, while a decline tends to lower them. Dynamics in the US, Chinese and Indian economies can also contribute to price swings: for the US and particularly China, their big industrial sectors use Silver in various processes; in India, consumers’ demand for the precious metal for jewellery also plays a key role in setting prices.
Silver prices tend to follow Gold's moves. When Gold prices rise, Silver typically follows suit, as their status as safe-haven assets is similar. The Gold/Silver ratio, which shows the number of ounces of Silver needed to equal the value of one ounce of Gold, may help to determine the relative valuation between both metals. Some investors may consider a high ratio as an indicator that Silver is undervalued, or Gold is overvalued. On the contrary, a low ratio might suggest that Gold is undervalued relative to Silver.
Author

Christian Borjon Valencia
FXStreet
Markets analyst, news editor, and trading instructor with over 14 years of experience across FX, commodities, US equity indices, and global macro markets.


