WTI Oil climbs as US-Iran standoff keeps Middle East supply risks elevated
- WTI climbs to its highest level in over three weeks as Middle East supply concerns stay in focus.
- US crude inventories rise by 4.405 million barrels, against expectations for a decline.
- Technically, WTI remains bullish but faces resistance at the 100-day SMA near $86.

West Texas Intermediate (WTI) Oil holds firm on Wednesday, hovering near its highest level in more than three weeks as traders balance Middle East supply risks against rising US crude inventories. At the time of writing, the US benchmark trades around $85.20 per barrel, up nearly 1% on the day.
Data from the US Energy Information Administration (EIA) showed that crude Oil inventories rose by 4.405 million barrels in the week ending August 14, while markets had expected a decline of 0.6 million barrels. This marked the third consecutive weekly increase in US crude stocks.
There are still no signs of negotiations to reopen the Strait of Hormuz after the 60-day memorandum of understanding between the United States (US) and Iran expired on Monday. Tehran maintains that the waterway will stay closed until Washington meets the conditions of the interim agreement.
Separate discussions between Iran and Oman over the joint management of the Strait have yet to produce meaningful progress toward reopening the waterway.
US President Donald Trump said in a Truth Social post on Tuesday that “there are no talks or conversations going on, or scheduled, with the Islamic Republic of Iran,” adding that the US naval blockade “remains in full force and effect.”
However, Trump told reporters on Wednesday that negotiations with Iran may take place “at some point.” He also said that many vessels passed through the Strait of Hormuz overnight.
Despite Trump’s comments, actual shipping activity remains limited. Kpler data showed that only six commodity vessels crossed the Strait on Tuesday, down from nine on Monday and below the recent daily average of eleven, according to Reuters.
Technical Analysis
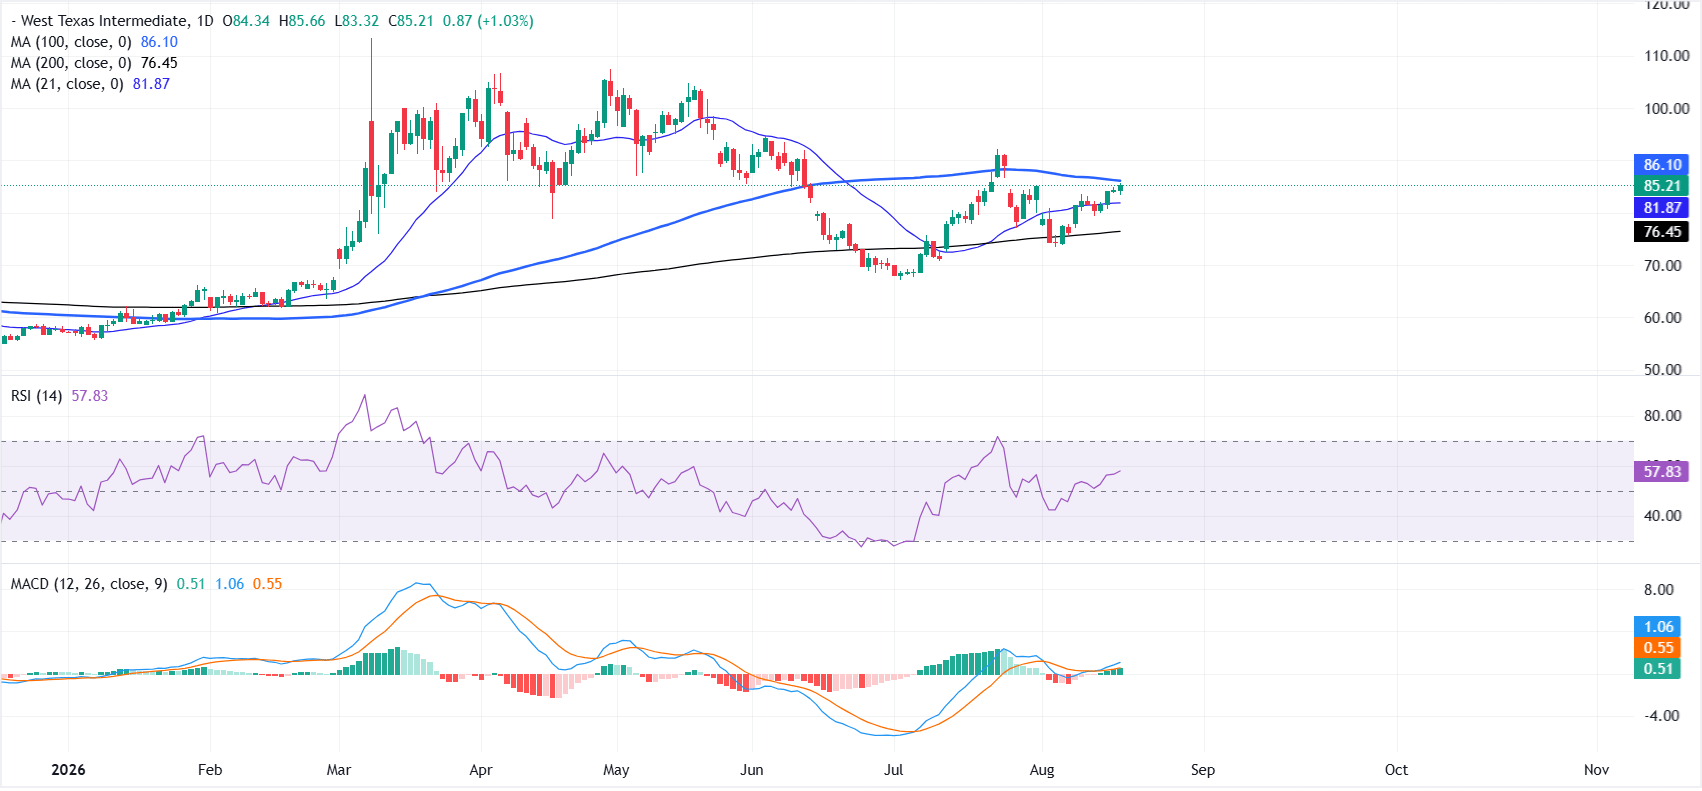
The near-term tone is bullish as WTI holds above the 21-day Simple Moving Average (SMA) around $82 and the 200-day SMA at $76, while only modestly capped by the 100-day SMA at $86 overhead.
The Relative Strength Index (RSI) on the daily chart at 58 stays in positive territory without reaching overbought extremes, and the Moving Average Convergence Divergence (MACD) indicator remains above zero, which together hint at constructive upside momentum while acknowledging nearby resistance.
On the topside, a clear break above the 100-day SMA near $86 could open the door toward the July high of $92.25. On the downside, initial support emerges at the 21-day SMA around $82, with deeper protection from the 200-day SMA near $76, where buyers would be expected to reappear if a corrective pullback unfolds.
(The technical analysis of this story was written with the help of an AI tool. Know more.)
WTI Oil FAQs
WTI Oil is a type of Crude Oil sold on international markets. The WTI stands for West Texas Intermediate, one of three major types including Brent and Dubai Crude. WTI is also referred to as “light” and “sweet” because of its relatively low gravity and sulfur content respectively. It is considered a high quality Oil that is easily refined. It is sourced in the United States and distributed via the Cushing hub, which is considered “The Pipeline Crossroads of the World”. It is a benchmark for the Oil market and WTI price is frequently quoted in the media.
Like all assets, supply and demand are the key drivers of WTI Oil price. As such, global growth can be a driver of increased demand and vice versa for weak global growth. Political instability, wars, and sanctions can disrupt supply and impact prices. The decisions of OPEC, a group of major Oil-producing countries, is another key driver of price. The value of the US Dollar influences the price of WTI Crude Oil, since Oil is predominantly traded in US Dollars, thus a weaker US Dollar can make Oil more affordable and vice versa.
The weekly Oil inventory reports published by the American Petroleum Institute (API) and the Energy Information Agency (EIA) impact the price of WTI Oil. Changes in inventories reflect fluctuating supply and demand. If the data shows a drop in inventories it can indicate increased demand, pushing up Oil price. Higher inventories can reflect increased supply, pushing down prices. API’s report is published every Tuesday and EIA’s the day after. Their results are usually similar, falling within 1% of each other 75% of the time. The EIA data is considered more reliable, since it is a government agency.
OPEC (Organization of the Petroleum Exporting Countries) is a group of 12 Oil-producing nations who collectively decide production quotas for member countries at twice-yearly meetings. Their decisions often impact WTI Oil prices. When OPEC decides to lower quotas, it can tighten supply, pushing up Oil prices. When OPEC increases production, it has the opposite effect. OPEC+ refers to an expanded group that includes ten extra non-OPEC members, the most notable of which is Russia.
Author

Vishal Chaturvedi
FXStreet
I am a macro-focused research analyst with over four years of experience covering forex and commodities market. I enjoy breaking down complex economic trends and turning them into clear, actionable insights that help traders stay ahead of the curve.

















