Silver Price Forecast: XAG/USD bulls await sustained move beyond $32.55 barrier
- Silver attracts some dip-buyers on Tuesday, though it lacks follow-through.
- The technical setup favors bulls and supports prospects for further gains.
- Any corrective slide below $32.00 could be seen as a buying opportunity.

Silver (XAG/USD) reverses an Asian session dip to the $32.00 neighborhood and climbs to the top end of its intraday trading range in the last hour. The white metal currently trades around the $32.35-$32.40 region, nearly unchanged for the day, though it remains well below the highest level since late October touched last Friday.
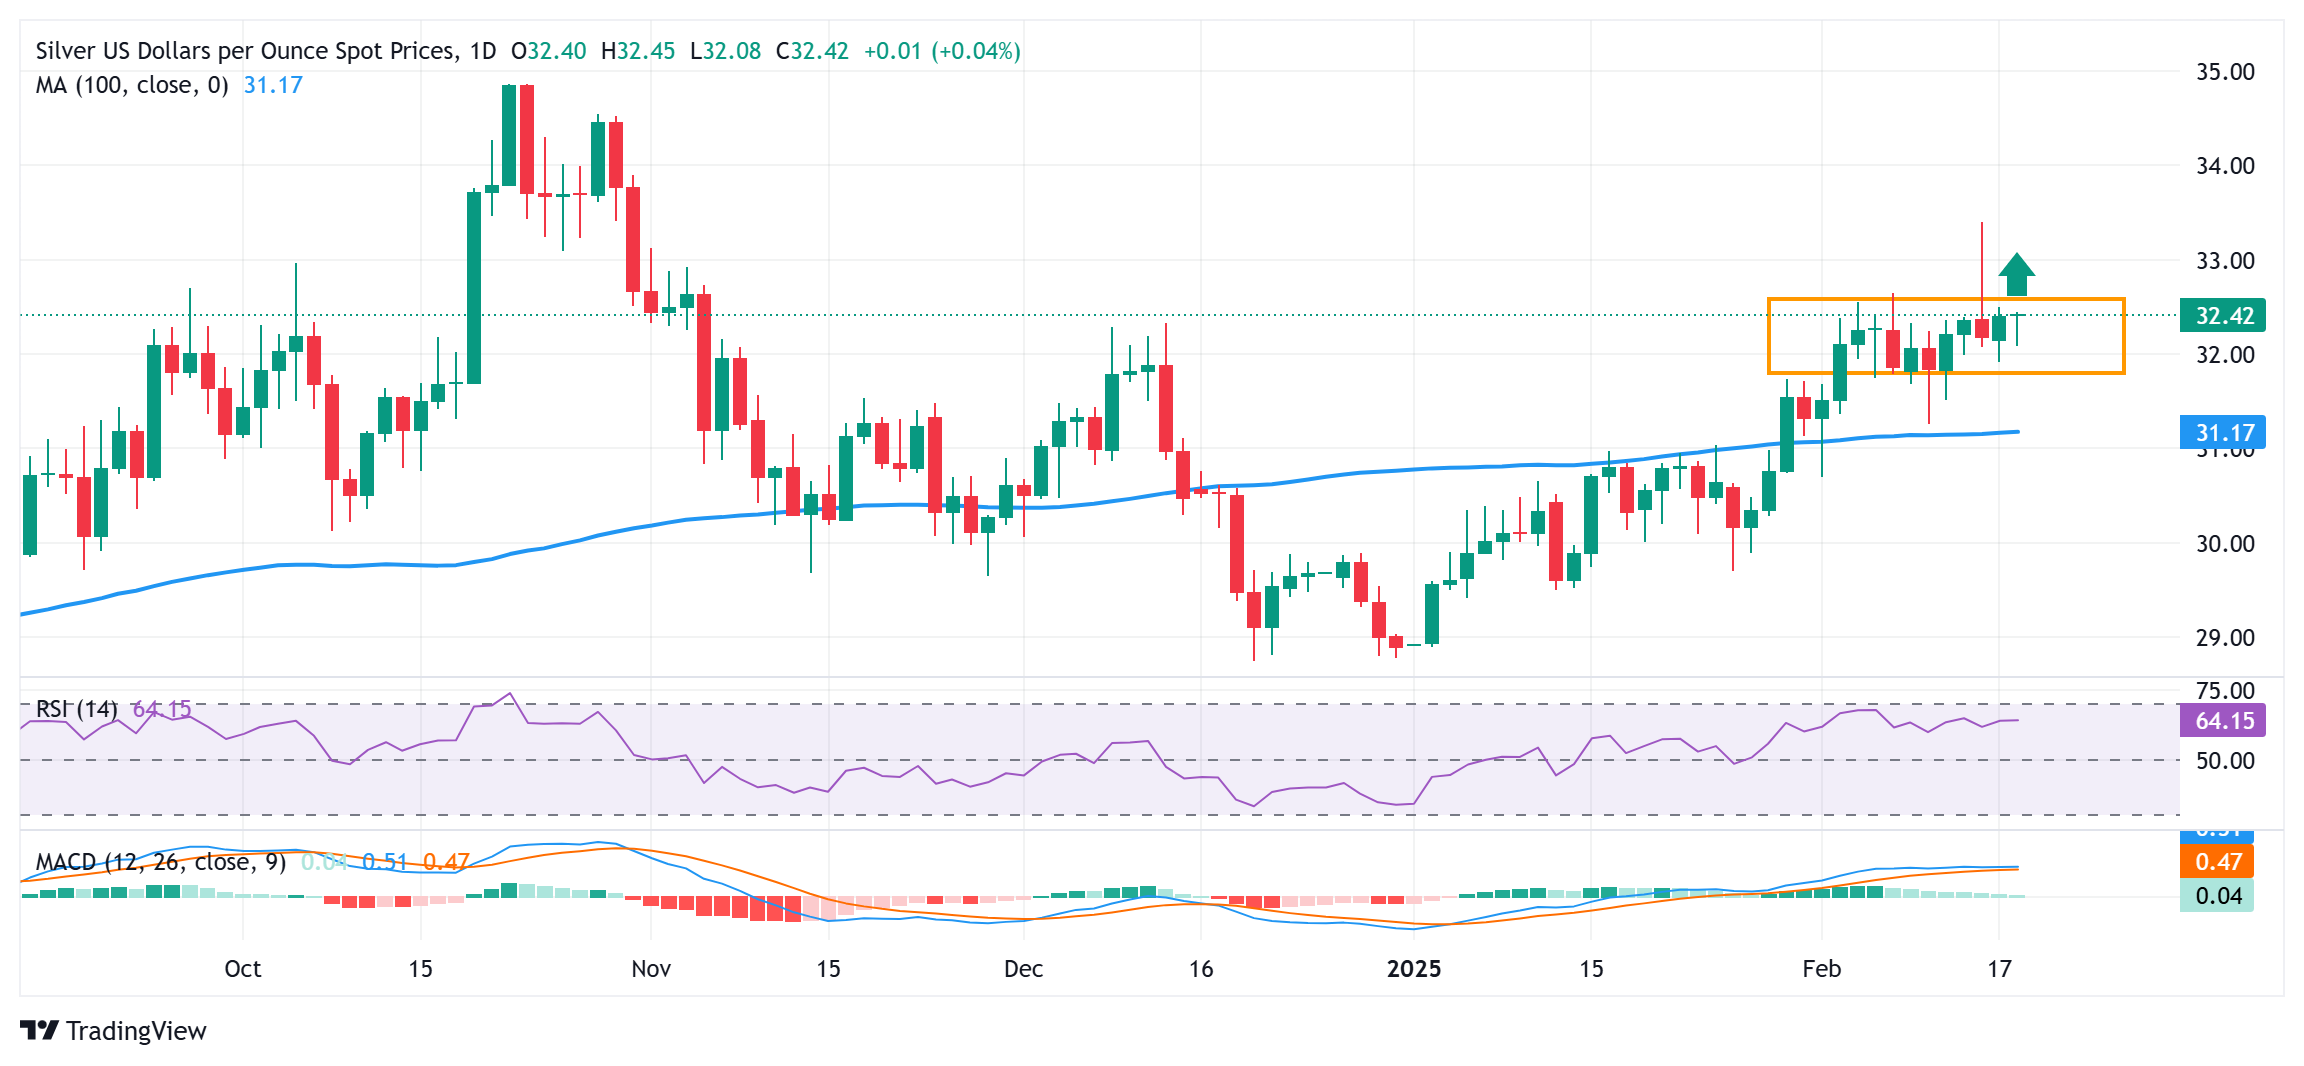
Looking at the broader picture, the XAG/USD – barring a couple of knee-jerk spikes – has been oscillating in a familiar range over the past two weeks or so. Against the backdrop of the year-to-date strong move up, this might still be categorized as a bullish consolidation phase. Adding to this, positive oscillators on the daily chart suggest that the path of least resistance for the commodity is to the upside.
That said, it will still be prudent to wait for some follow-through strength beyond the $32.55 horizontal barrier before positioning for a move toward the $33.00 mark. The XAG/USD might then climb further towards last Friday's swing high, around the $33.35-$33.40 zone en route to the $34.00 round figure, the $34.45 intermediate hurdle, and the $35.00 neighborhood, or the multi-year peak touched in October.
On the flip side, weakness below the $32.00-$31.90 region now seems to have emerged as an immediate strong support. This is followed by the lower boundary of the short-term trading range, around the $31.75-$31.70 region, below which the XAG/USD could slide toward retesting the 100-day Simple Moving Average (SMA), currently pegged near the $31.20 area, before dropping to the $31.00 round figure mark.
Some follow-through selling below the latter might shift the near-term bias in favor of bearish traders and pave deeper losses. The subsequent fall has the potential to drag the XAG/USD towards the next relevant support near the $30.25 region en route to the $30.00 psychological mark and the $29.55-$29.50 horizontal zone.
Silver daily chart
Silver FAQs
Silver is a precious metal highly traded among investors. It has been historically used as a store of value and a medium of exchange. Although less popular than Gold, traders may turn to Silver to diversify their investment portfolio, for its intrinsic value or as a potential hedge during high-inflation periods. Investors can buy physical Silver, in coins or in bars, or trade it through vehicles such as Exchange Traded Funds, which track its price on international markets.
Silver prices can move due to a wide range of factors. Geopolitical instability or fears of a deep recession can make Silver price escalate due to its safe-haven status, although to a lesser extent than Gold's. As a yieldless asset, Silver tends to rise with lower interest rates. Its moves also depend on how the US Dollar (USD) behaves as the asset is priced in dollars (XAG/USD). A strong Dollar tends to keep the price of Silver at bay, whereas a weaker Dollar is likely to propel prices up. Other factors such as investment demand, mining supply – Silver is much more abundant than Gold – and recycling rates can also affect prices.
Silver is widely used in industry, particularly in sectors such as electronics or solar energy, as it has one of the highest electric conductivity of all metals – more than Copper and Gold. A surge in demand can increase prices, while a decline tends to lower them. Dynamics in the US, Chinese and Indian economies can also contribute to price swings: for the US and particularly China, their big industrial sectors use Silver in various processes; in India, consumers’ demand for the precious metal for jewellery also plays a key role in setting prices.
Silver prices tend to follow Gold's moves. When Gold prices rise, Silver typically follows suit, as their status as safe-haven assets is similar. The Gold/Silver ratio, which shows the number of ounces of Silver needed to equal the value of one ounce of Gold, may help to determine the relative valuation between both metals. Some investors may consider a high ratio as an indicator that Silver is undervalued, or Gold is overvalued. On the contrary, a low ratio might suggest that Gold is undervalued relative to Silver.
Author

Haresh Menghani
FXStreet
Haresh Menghani is a detail-oriented professional with 10+ years of extensive experience in analysing the global financial markets.


