|

Silver Price Analysis: XAG/USD’s uptrend capped at the 200-DMA, retraced back below $21.80

  • Silver spot price climbed on Monday, though the 200-DMA capped its uptrend.
  • XAG/USD Price Analysis: The most likely scenario is downwards, with solid resistance from $21.90 and beyond.

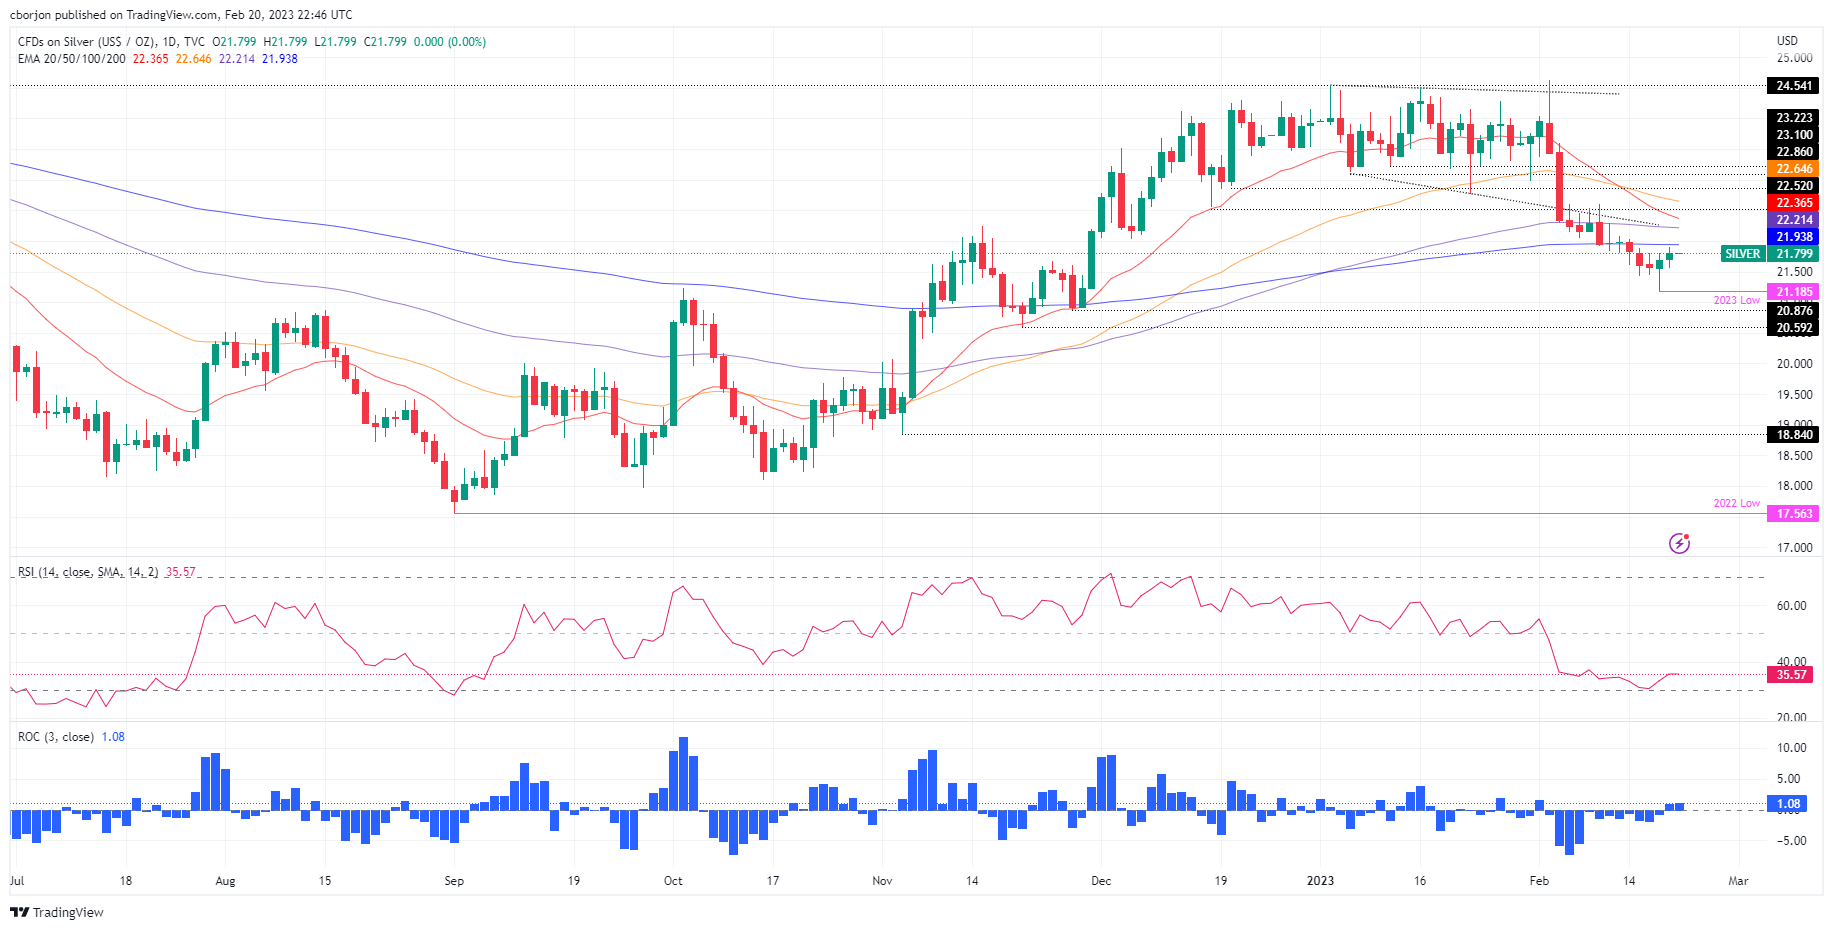
Silver price registered gains on Monday amidst thin liquidity conditions due to a US holiday. However, its rally was capped at a technical juncture, with the important 200-day Exponential Moving Average (EMA) rejecting higher prices for the white metal. Consequently, the XAG/USD retreated and settled at around $21.79 a troy ounce at the time of typing.

The XAG/USD daily chart portrays a large area of resistance resting above Silver’s spot price, led by the 200-day EMA at $21.93, followed by the 100, 20, and 50-day EMAs, each at $22.21, $22.36, and $22.64, respectively. Hence, the XAG/USD path of least resistance is downward biased. Still, the Relative Strength Index (RSI) turning flat at bearish territory, and the Rate of Change (RoC) almost neutral, suggests that bears are taking a respite before attacking the year’s lows.

Therefore, the XAG/USD first support would be the YTD low at $21.18. Once the white metal crosses the latter, it will expose the $21.00 figure, followed by the November 22 swing low at $20.87, and then the November 21 low at $20.59, ahead of the psychological $20.00 figure.

As an alternate scenario, if XAG’s bulls reclaim the 200-day EMA and the $22.00 mark, that would pave the way to retest the 100-day EMA.

XAG/USD Daily chart

XAG/USD Key technical levels

XAG/USD

Overview
Today last price21.82
Today Daily Change0.06
Today Daily Change %0.28
Today daily open21.76
 
Trends
Daily SMA2022.76
Daily SMA5023.34
Daily SMA10021.98
Daily SMA20021.02
 
Levels
Previous Daily High21.81
Previous Daily Low21.18
Previous Weekly High22.08
Previous Weekly Low21.18
Previous Monthly High24.55
Previous Monthly Low22.76
Daily Fibonacci 38.2%21.57
Daily Fibonacci 61.8%21.42
Daily Pivot Point S121.36
Daily Pivot Point S220.96
Daily Pivot Point S320.73
Daily Pivot Point R121.99
Daily Pivot Point R222.21
Daily Pivot Point R322.62

Author

Christian Borjon Valencia

Christian Borjon began his career as a retail trader in 2010, mainly focused on technical analysis and strategies around it. He started as a swing trader, as he used to work in another industry unrelated to the financial markets.

More from Christian Borjon Valencia
Share:

Markets move fast. We move first.

Orange Juice Newsletter brings you expert driven insights - not headlines. Every day on your inbox.

By subscribing you agree to our Terms and conditions.

Editor's Picks

EUR/USD steadies near 1.1750 ahead of final Eurozone CPI amid fading USD recovery

The EUR/USD pair steadies around the 1.1750 area during the Asian session on Wednesday, and for now, seems to have stalled the previous day's sharp retracement slide from the highest level since September 24. Meanwhile, the fundamental backdrop remains tilted in favor of bullish traders and suggests that the path of least resistance for spot prices remains to the upside.

GBP/USD gains ground above 1.3400 on UK PMI optimism

The GBP/USD pair gains momentum to around 1.3425 during the early Asian session on Wednesday. The Pound Sterling edges higher against the Greenback on the upbeat UK preliminary S&P Global Purchasing Managers' Index data. Traders will take more cues from the Fedspeak later on Wednesday. 

Gold advances to near seven-week highs amid US labor market cooling

Gold price extends its upside to near seven-week highs above $4,300 during the Asian trading hours on Wednesday. The precious metal gains momentum as the US labor market remains relatively resilient but shows signs of slowing. The mixed US employment report for November reinforces bets of further rate cuts by the US Federal Reserve and weighs on the US Dollar.

Top Crypto Gainers: SPX6900, Pi Network, Filecoin – Sudden rebound lifts bullish spirit

SPX6900, Pi Network, and Filecoin emerge as top gainers in the last 24 hours as the broader cryptocurrency market remains under bearish pressure. The sudden rebound in SPX, PI, and FIL suggests a possible rally, as the Moving Average Convergence Divergence indicator on the 4-hour chart flashes a buy signal. 

Ukraine-Russia in the spotlight once again

Since the start of the week, gold’s price has moved lower, but has yet to erase the gains made last week. In today’s report we intend to focus on the newest round of peace talks between Russia and Ukraine, whilst noting the release of the US Employment data later on day and end our report with an update in regards to the tensions brewing in Venezuela.

BNB Price Forecast: BNB slips below $855 as bearish on-chain signals and momentum indicators turn negative

BNB, formerly known as Binance Coin, continues to trade down around $855 at the time of writing on Tuesday, after a slight decline the previous day. Bearish sentiment further strengthens as BNB’s on-chain and derivatives data show rising retail activity.