|

Silver Price Analysis: XAG/USD tumbles over 5% as Silver whipsaws for Friday

  • XAG/USD fell $1.28 during the US trading session, backsliding into $22.30.
  • Bulls failed to establish a floor in XAG/USD prices and Silver slumped to a new weekly low.
  • Broad-market reversal in risk appetite sending Silver into the floorboards.

Silver prices have tumbled from a late-week peak for Friday's trading, skidding into $22.30 after falling over 5.5% over the course of the US trading session.

The XAG/USD is back into familiar lows that Silver has cycled into for most of the year, driven by a resurgence in US Dollar (USD) bidding as global markets routinely pivot on fears of an impending economic slowdown that could roll over into a full-blown 'hard landing' if left unchecked.

Silver prices have consistently waffled on the top end ever since slipping from 2023's early peak above $26.00, a high set back in May.

Friday's sharp reversal only serves to highlight the XAG/USD's large exposure to broader market sentiment, tracking closely with US Dollar flows.

XAG/USD technical outlook

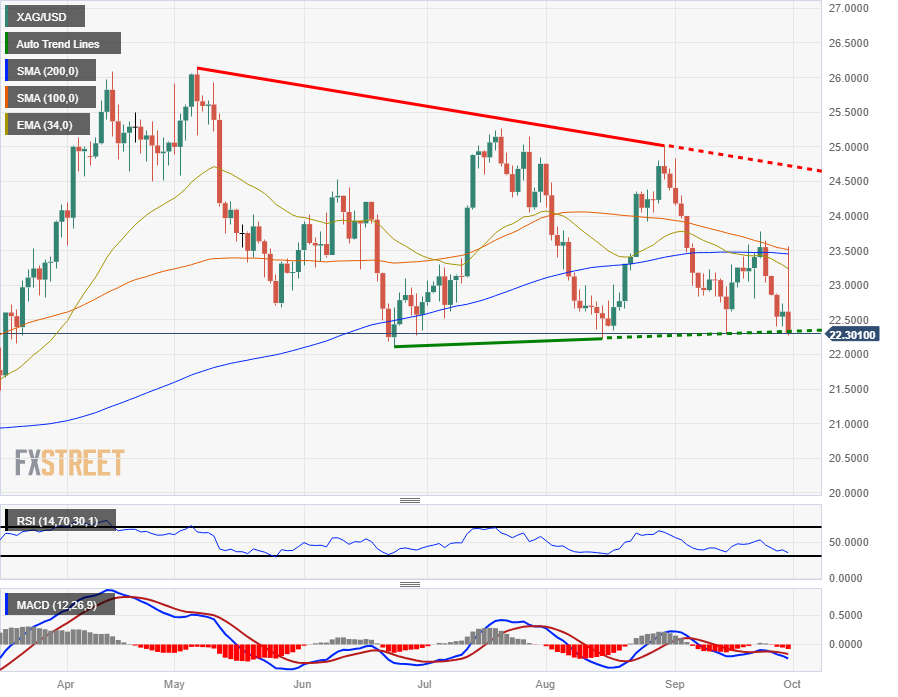
Silver is trading back into a familiar bottom just above the $22.00 major psychological level. A descending pattern of lower highs in XAG/USD is capping off long-term bullish potential, and a descending trendline is marked in from May's peak just north of $26.00.

Despite Friday's bomb-drop into the floor, the XAG/USD could potentially be set for another bullish turn around the cyclical pattern if Silver bidders can amass enough to arrest the current slide.

On the down side, if risk-off price pressure maintain through the weekend and into next week, Silver could see itself dropping further below $23.00 and set up a bearish push into $22.00 and beyond into six-month lows.

XAG/USD daily chart
XAG/USD technical levels

XAG/USD

Overview
Today last price22.32
Today Daily Change-0.30
Today Daily Change %-1.33
Today daily open22.62
 
Trends
Daily SMA2023.17
Daily SMA5023.49
Daily SMA10023.53
Daily SMA20023.46
 
Levels
Previous Daily High22.74
Previous Daily Low22.4
Previous Weekly High23.78
Previous Weekly Low22.81
Previous Monthly High25.02
Previous Monthly Low22.23
Daily Fibonacci 38.2%22.61
Daily Fibonacci 61.8%22.53
Daily Pivot Point S122.43
Daily Pivot Point S222.25
Daily Pivot Point S322.1
Daily Pivot Point R122.77
Daily Pivot Point R222.92
Daily Pivot Point R323.11

Author

Joshua Gibson

Joshua joins the FXStreet team as an Economics and Finance double major from Vancouver Island University with twelve years' experience as an independent trader focusing on technical analysis.


More from Joshua Gibson
Share:

Editor's Picks

GBP/USD struggles as traders evaluate BoE policy, UK political developments

GBP/USD steadies after three days of losses, trading around 1.3430 during the Asian hours on Tuesday. After recently surging toward two-month highs near 1.3550, the pair has moderated as foreign exchange traders evaluate shifting monetary policies between the Bank of England and the US Federal Reserve alongside political developments in the United Kingdom.

EUR/USD bears retain control below 200-SMA on H4; break of 1.1400 awaited

The EUR/USD pair is seen consolidating during the Asian session on Tuesday and trading just above the 1.1400 mark, or a four-day low touched the previous day. Market participants seem hesitant and keenly await the highly-anticipated European Central Bank meeting on Thursday before positioning for the next leg of a directional move.


Gold: Acceptance above 21-day SMA at $4,065 is critical for buyers

Gold is building on its recovery from two-week lows of $4,024 reached last Friday, extending the winning streak into a third straight day on Tuesday. XAU/USD is capitalizing on the ongoing pullback in Oil prices from monthly highs near $84.50. The black gold is retreating for a second day in a row on emerging signs of diplomatic efforts to ease the US-Iran conflict.

Ripple and Stellar: Mixed signals keep traders at a crossroads

Ripple and Stellar trade within tight ranges as traders await the next directional move. XRP’s technical indicators suggest bearish momentum is fading, while XLM continues to consolidate near a critical support zone. Mixed derivatives metrics highlight growing market indecision, raising the likelihood of a volatile breakout in either direction in the coming days.

Here's where the Canadian Dollar is headed next: 4 bearish scenarios and a bullish one
The Canadian Dollar (CAD) has ridden a volatile first half of the year, with Oil prices surging and then falling as markets danced to the Middle East’s tune. Neither the Bank of Canada nor the Federal Reserve has changed rates so far this year, and the USD/CAD's next move may depend on which of the two banks fails to deliver what markets expect.
US Dollar mid-year outlook: Exceptional currency, exceptional risks?
The US Dollar enters the second half of 2026 in a markedly different position from a year ago. The King currency has recovered, reflecting persistent US inflation, changing expectations for Fed policy, geopolitical tensions and renewed demand for defensive assets.












