|

Silver Price Analysis: XAG/USD tumbles as bearish engulfing pattern looms

  • Silver prices see a significant drop to $24.75, shedding over 3% in response to a strengthening US Dollar.
  • Technical analysis reveals a bearish engulfing pattern, despite a recent 'golden cross', signaling mixed signals for traders.
  • The RSI indicates diminishing buying pressure, hinting at a potential bearish swing.

Silver's price plunged on Thursday amidst a risk-off impulse, reinvigorating the US Dollar. Consequently, the grey metal dropped more than $0.70, or 3.15%, as the XAG/USD traded at $24.75 after hitting a daily high of $25.77.

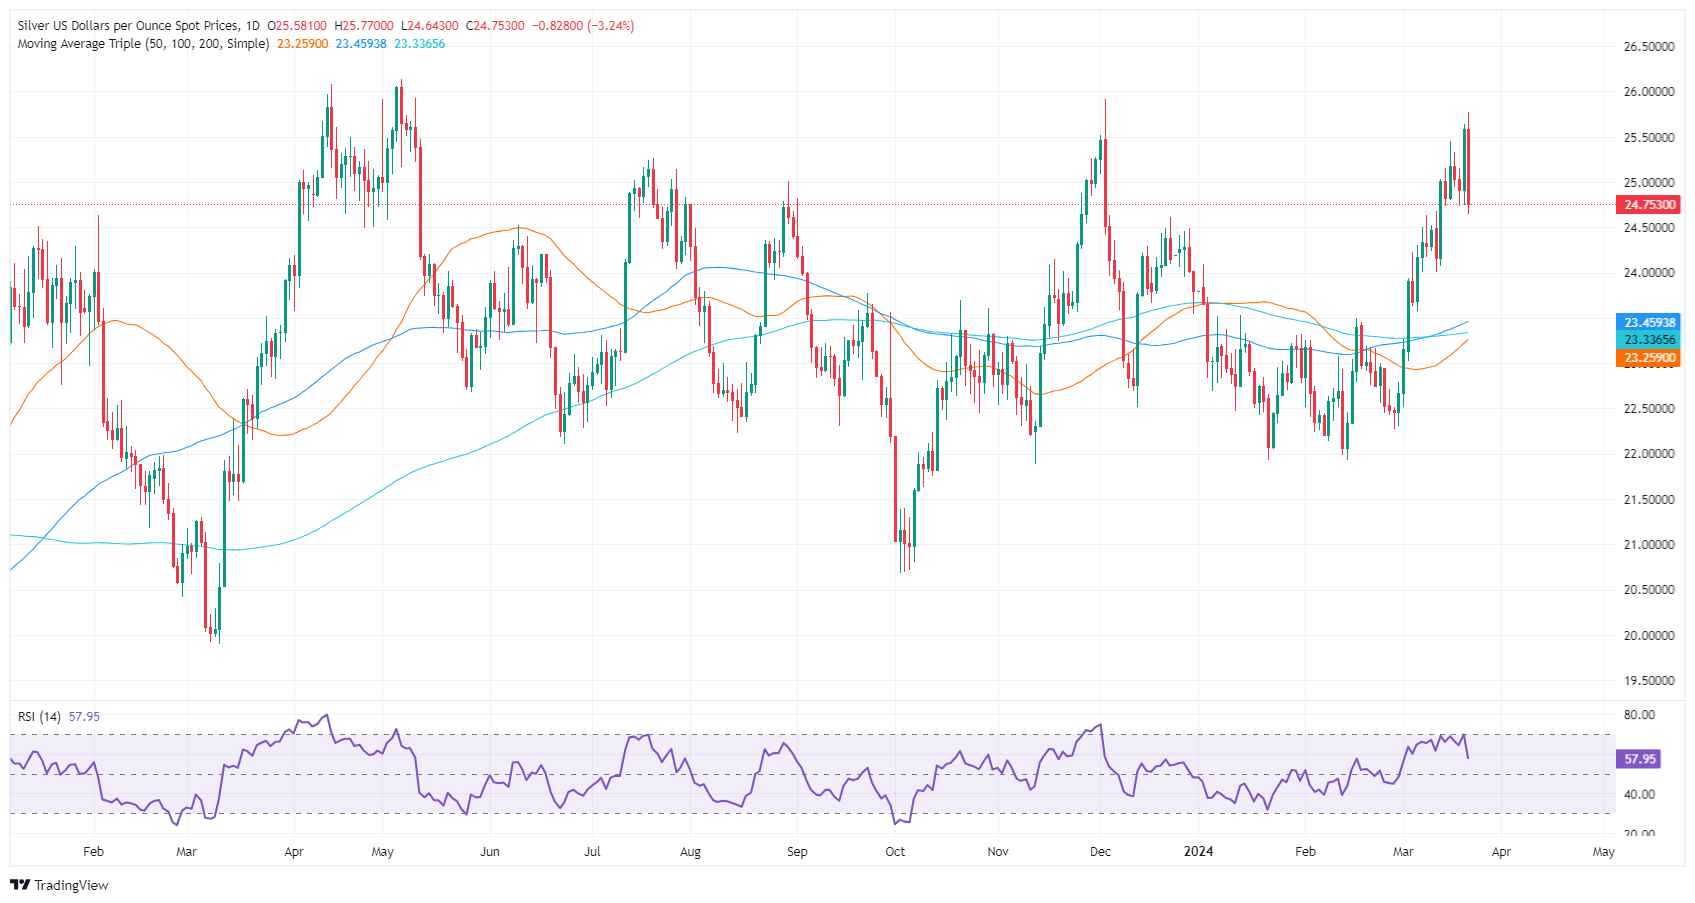
XAG/USD Price Analysis: Technical outlook

Silver is witnessing a downturn, as price action has formed a ‘bearish engulfing’ chart pattern in the last couple of days. Even though the 50-day moving average (DMA) has crossed above the 200-DMA, forming a classic ‘golden cross’ indicating that bulls are gathering steam, momentum suggests the opposite.

The Relative Strength Index (RSI) is hovering just below 60 after peaking around 70, indicating that moderate buying pressure remains. However, the RSI's descent from higher levels suggests that momentum might wane, and bears could gain ground.

The recent pullback has seen the price retreat from resistance near the $26.00 mark. Immediate support is found near December’s 22 high turned support at $24.60, followed by the $24.00 level. A breach of the latter could open a path towards the $23.00 area, marked by the previous cycle lows.

On the other hand, an XAG/USD daily close above $25.00 could pave the way for challenging yearly highs at $25.77, followed by last year’s high at $25.91.

XAG/USD Price Action – Daily Chart

XAG/USD

Overview
Today last price24.76
Today Daily Change-0.82
Today Daily Change %-3.21
Today daily open25.58
 
Trends
Daily SMA2023.93
Daily SMA5023.22
Daily SMA10023.44
Daily SMA20023.33
 
Levels
Previous Daily High25.64
Previous Daily Low24.75
Previous Weekly High25.45
Previous Weekly Low24.01
Previous Monthly High23.5
Previous Monthly Low21.93
Daily Fibonacci 38.2%25.3
Daily Fibonacci 61.8%25.09
Daily Pivot Point S125
Daily Pivot Point S224.43
Daily Pivot Point S324.11
Daily Pivot Point R125.9
Daily Pivot Point R226.22
Daily Pivot Point R326.79

Author

Christian Borjon Valencia

Christian Borjon began his career as a retail trader in 2010, mainly focused on technical analysis and strategies around it. He started as a swing trader, as he used to work in another industry unrelated to the financial markets.

More from Christian Borjon Valencia
Share:

Markets move fast. We move first.

Orange Juice Newsletter brings you expert driven insights - not headlines. Every day on your inbox.

By subscribing you agree to our Terms and conditions.

Editor's Picks

EUR/USD extends slide below 1.1700

The EUR/USD pair nears its weekly low at around 1.1660 in the American session on Tuesday, retreating from the 1.1750 price zone tested earlier in the day. Cautiously optimistic markets support the US Dollar in the near term.

GBP/USD consolidates around 1.3500; looks to US macro data for fresh impetus

The GBP/USD pair oscillates in a narrow range, around the 1.3500 psychological mark during the Asian session on Wednesday, and for now, seems to have stalled the previous day's retracement slide from its highest level since September 18. Moreover, the fundamental backdrop seems tilted in favor of bullish traders and suggests that the path of least resistance for spot prices is to the upside.

Gold extends upside to near $4,500 on Venezuela turmoil

Gold price climbs to near $4,500 during the early Asian trading hours on Wednesday. The precious metal rises by more than 1% in the day as geopolitical tensions and expectations of US rate cuts keep demand for gold high. The US ISM Services Purchasing Managers Index report will be published on Wednesday. 

Pump.fun prepares for early-year rally as DEX volume skyrockets

Pump.fun (PUMP) is rising alongside crypto majors such as Bitcoin (BTC) and is trading above $0.002400 at the time of writing on Tuesday. The Decentralized Exchange (DEX) native token outlook builds on a bullish tone developed since December 30.

Implications of US intervention in Venezuela

Events in Venezuela are top of mind for market participants, and while developments are associated with an elevated degree of uncertainty, we are not making any changes to our markets or economic forecasts as a result of the deposition of Nicolás Maduro. 

Cardano holds steady as bulls intensify push for breakout

Cardano rises above the 50-day EMA resistance amid a risk-on mood across the crypto market. The MACD upholds positive divergence, increasing the potential for a 20% breakout to $0.505.