|

Silver Price Analysis: XAG/USD test key resistance levels amid uptrends

  • Silver dips to $26.54, down 0.43%; 'dragonfly doji' hints at possible uptrend.
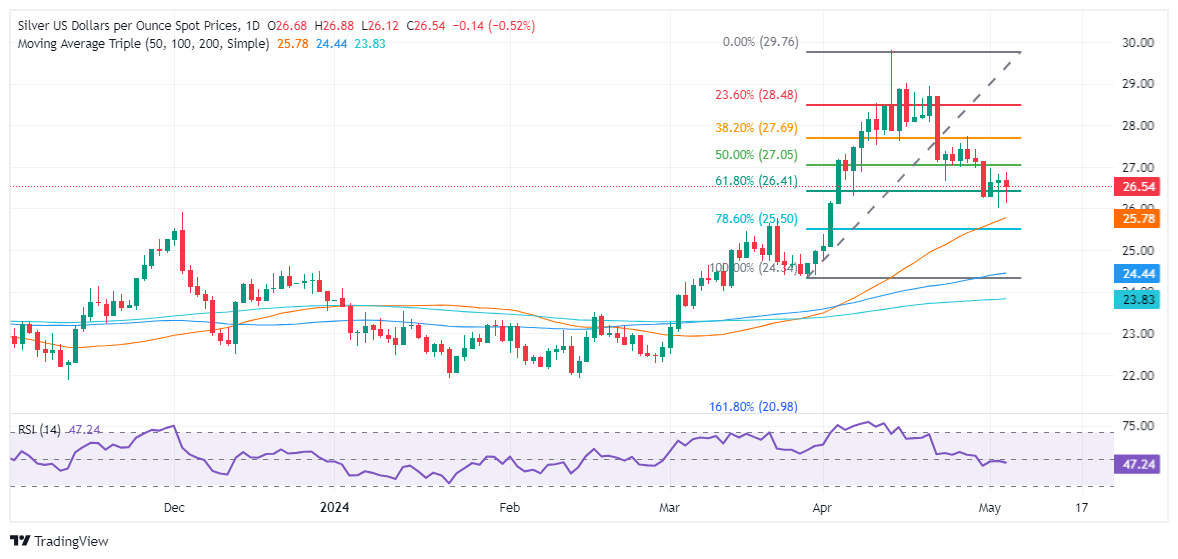
  • Finds support at 61.8% Fibonacci level ($26.41); crossing $27.00 could boost bullish momentum.
  • Downside risk if below May 2 low of $26.02, aiming for 50-day MA at $25.79.

Silver price uptrend continued during the week despite registering losses of around 2.40%. Nevertheless, May 2’s price action forming a ‘dragonfly doji,’ a bullish candle, alongside technical indicators suggesting that the grey metal remains bullish, could pave the way for a recovery. At the time of writing, XAG/USD trades at $26.54, down 0.43%.

XAG/USD Price Analysis: Technical outlook

As previously mentioned, Silver remains bullishly biased after posting an impressive rally that passed the $29.00 mark. It appears to have bottomed out at around the 61.8% Fibonacci retracement at $26.41, though buyers had been unable to test the $27.00 mark.

Although momentum had shifted bearishly, with the Relative Strength Index (RSI) diving below the 50-midline, upside risks remain. If buyers reclaim the $27.00 figure, that could reignite buying pressure and pave the way to challenge the next resistance level seen at the 38.2% Fibo retracement at $27.70. Once surpassed, the next step would be the 23.6% Fibo retracement at $28.49.

Nevertheless, with the RSI standing at bearish territory, sellers need to push prices below the May 2 low of $26.02. Once cleared the next stop would be the 50-day moving average (DMA) at $25.79, followed by the 78.6% Fibo retracement at $25.50.

XAU/USD Price Action – Daily Chart

XAG/USD

Overview
Today last price26.54
Today Daily Change-0.14
Today Daily Change %-0.52
Today daily open26.68
 
Trends
Daily SMA2027.65
Daily SMA5025.7
Daily SMA10024.42
Daily SMA20023.82
 
Levels
Previous Daily High26.82
Previous Daily Low26.02
Previous Weekly High28.69
Previous Weekly Low26.67
Previous Monthly High29.8
Previous Monthly Low24.75
Daily Fibonacci 38.2%26.51
Daily Fibonacci 61.8%26.32
Daily Pivot Point S126.19
Daily Pivot Point S225.7
Daily Pivot Point S325.39
Daily Pivot Point R127
Daily Pivot Point R227.31
Daily Pivot Point R327.8

Author

Christian Borjon Valencia

Christian Borjon began his career as a retail trader in 2010, mainly focused on technical analysis and strategies around it. He started as a swing trader, as he used to work in another industry unrelated to the financial markets.

More from Christian Borjon Valencia
Share:

Markets move fast. We move first.

Orange Juice Newsletter brings you expert driven insights - not headlines. Every day on your inbox.

By subscribing you agree to our Terms and conditions.

Editor's Picks

EUR/USD bounces toward 1.1750 as US Dollar loses strength

EUR/USD returned to the 1.1750 price zone in the American session on Friday, despite falling Wall Street, which indicates risk aversion. Trading conditions remain thin following the New Year holiday and ahead of the weekend, with the focus shifting to US employment and European data scheduled for next week.

GBP/USD nears 1.3500, holds within familiar levels

After testing 1.3400 on the last day of 2025, GBP/USD managed to stage a rebound. Nevertheless, the pair finds it difficult to gather momentum and trades with modest intraday gains at around 1.3490 as market participants remain in holiday mood.

Gold trims intraday gains, approaches $4,300

Gold retreated sharply from the $4,400  area and trades flat for the day in the $4,320 price zone. Choppy trading conditions exacerbated the intraday decline, although XAU/USD bearish case is out of the picture, considering growing expectations for a dovish Fed and persistent geopolitical tensions.

Breaking: US Trump strikes Venezuela, claims President Maduro was captured and flown out of the country

United States (US) President Donald Trump has fulfilled his threats and finally struck Venezuela. Different media reports that explosions in Caracas began around 1:50 am local time on Saturday, leaving multiple areas of the city without power.

Economic outlook 2026-2027 in advanced countries: Solidity test

After a year marked by global economic resilience and ending on a note of optimism, 2026 looks promising and could be a year of solid economic performance. In our baseline scenario, we expect most of the supportive factors at work in 2025 to continue to play a role in 2026.

Crypto market outlook for 2026

Year 2025 was volatile, as crypto often is.  Among positive catalysts were favourable regulatory changes in the U.S., rise of Digital Asset Treasuries (DAT), adoption of AI and tokenization of Real-World-Assets (RWA).