|

Silver Price Analysis: XAG/USD stumbles, falling back into $23

  • Silver trips and tumbles in Monday trading, heading towards $23.00.
  • The XAG/USD failed to capture $23.80 on Friday, and Silver is heading back into recent swing low territory.
  • A bouncing US Dollar Index is seeing the XAG/USD take a step lower.

Silver is falling further back to kick off the new trading week, testing into familiar lows after last Friday's bounce couldn't be sustained.

The Federal Reserve (Fed) is set to see interest rates holding higher for longer than previously expected, and the boost to the US Dollar Index (DXY) is capping off recent upside swings for the XAG/USD.

After the Fed upped their interest rate forecast, or "dot plot" last week, the US central bank expects interest rates to only decline half a percent by the end of 2024. The Federal Open Market Committee (FOMC) previously saw end-2024 rates at 4.6%, but sticky inflation complications saw the Fed up their forecast to 5.1%.

XAG/USD technical outlook

On the hourly candles, Silver is looking to build a floor near the 200-hour Simple Moving Average (SMA) near $23.15 after tumbling around 2.5% from Monday's highs near $23.65.

Intraday upside momentum will be looking to recapture familiar territory north of the 100-hour SMA currently settling near $23.35.

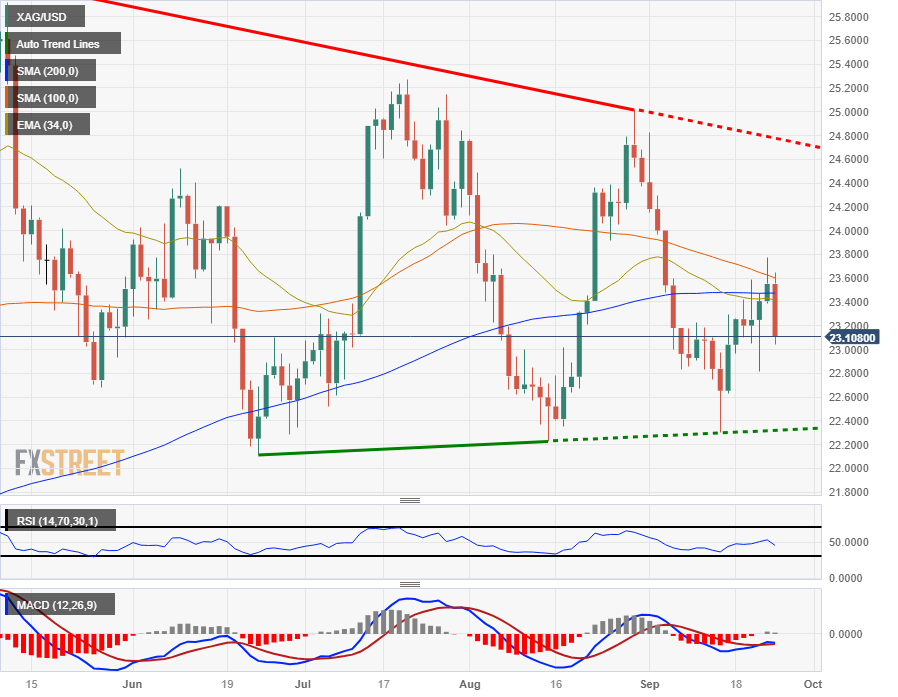
Silver is suffering from a notable lack of meaningful trend momentum in the long-term, with the XAG/USD cycling the 200-day SMA on daily candlesticks.

Price action is constrained to the middle as Silver consolidates, with lower highs and slightly higher lows trapping XAG/USD into the midrange.

Swing lows are pricing in near $22.40, with the top end set to run into a descending trendline near $24.40.

XAG/USD daily chart

XAG/USD technical levels

XAG/USD

Overview
Today last price23.11
Today Daily Change-0.44
Today Daily Change %-1.87
Today daily open23.55
 
Trends
Daily SMA2023.51
Daily SMA5023.67
Daily SMA10023.63
Daily SMA20023.47
 
Levels
Previous Daily High23.78
Previous Daily Low23.39
Previous Weekly High23.78
Previous Weekly Low22.81
Previous Monthly High25.02
Previous Monthly Low22.23
Daily Fibonacci 38.2%23.63
Daily Fibonacci 61.8%23.54
Daily Pivot Point S123.37
Daily Pivot Point S223.19
Daily Pivot Point S322.98
Daily Pivot Point R123.75
Daily Pivot Point R223.96
Daily Pivot Point R324.14

Author

Joshua Gibson

Joshua joins the FXStreet team as an Economics and Finance double major from Vancouver Island University with twelve years' experience as an independent trader focusing on technical analysis.

More from Joshua Gibson
Share:

Editor's Picks

GBP/USD extends slide to fresh 2026-low near 1.3150

GBP/USD resumes its downside in the second half of the day on Wednesday and trades at its lowest level since November 2025 near 1.3150. The pair remains vulnerable amid a broadly firmer US Dollar and chaotic UK political environment. The focus is now on BoE-speak for further trading impetus.

EUR/USD slumps to new yearly low below 1.1350

EUR/USD stays under bearish pressure and trades at its lowest level in a year below 1.1350 on Wednesday. The pair remains vulnerable to further declines amid a bullish US Dollar, which continues to draw support from hawkish Fed bets and US-Iran peace deal uncertainty.

Gold drops toward $4,000 on persistent USD strength

Gold remains under persistent selling pressure and trades below $4,050 on Wednesday, losing more than 1.5% on the day. Hawkish Fed prising, broad-based US Dollar strength and the uncertainty surrounding the US-Iran peace agreement make it difficult for the precious metal to find a foothold.

Dogecoin tests a key make-or-break point amid waning retail support

Dogecoin trades below $0.08000 maintaining a steady decline for the seventh straight week. The meme coin is losing its retail strength as DOGE futures Open Interest drops 10% in 24 hours, while institutional demand remains muted with zero inflows so far this week.

Tech rout weighs on US stocks as the USD clocks a fresh 2026 high

Major US equity benchmarks ended Tuesday’s session considerably in the red, with the Nasdaq 100 down 3.3%, the S&P 500 off by 1.4%, and the Dow Jones down 0.1%. Stocks were largely weighed down by tech amid doubts over the AI-driven rally; the Philadelphia Semiconductor Index slid nearly 8%.

Regime change: Inside Kevin Warsh's first move to make the Fed unreadable on purpose

The rate did not move. That was the least interesting thing about Kevin Warsh's first meeting in charge of the Fed. The FOMC held its benchmark at 3.50%-3.75% for the fourth straight meeting, exactly as priced, and then the new chair used his first press conference to dismantle the machinery the market has leaned on for a decade.