Silver Price Analysis: XAG/USD struggles to defend 100-SMA breakout
- Silver prices grind higher following the rebound from weekly low.
- Fortnight-old resistance line, sluggish MACD question buyers despite breaking the key SMA.
- Horizontal area from September 20 restricts short-term downside.

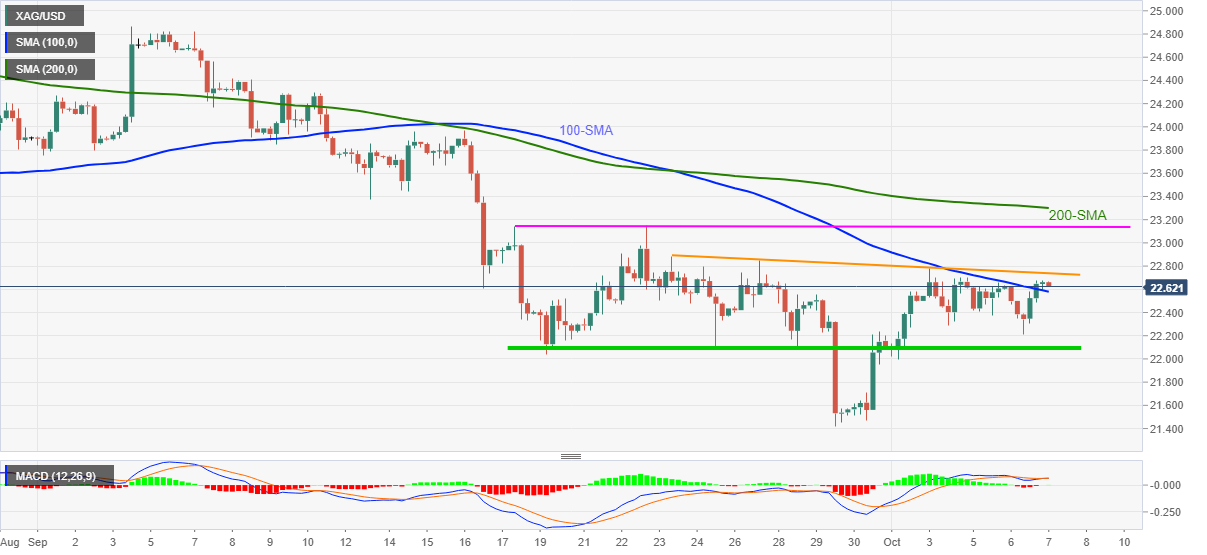
Silver (XAG/USD) fades recovery moves from the weekly bottom around $22.60 during Thursday’s Asian session. In doing so, the bright metal fails to extend the 100-SMA break out below a two-week-long resistance line.
As sluggish MACD portrays a lack of market support to the rebound, the metal is likely to drop back towards the key SMA level of $22.57.
However, a three-week-old horizontal support area near $22.10, followed by the $22.00 threshold, will restrict the quote’s further weakness.
Should silver bears dominate past $22.00, $21.60 may offer an intermediate halt during the fall targeting the yearly low near $21.40.
Alternatively, a clear upside break of the stated resistance line around $22.75 needs validation from double tops marked in September at around $23.15.
Also acting as important resistance for silver traders is the 200-SMA level of $23.30.
Silver: Four-hour chart
Trend: Pullback expected
Author

Anil Panchal
FXStreet
Anil Panchal has nearly 15 years of experience in tracking financial markets. With a keen interest in macroeconomics, Anil aptly tracks global news/updates and stays well-informed about the global financial moves and their implications.


