- Silver gains strong positive traction and moves away from a one-month low touched on Thursday.
- Technical indicators on the daily chart warrant some caution before placing aggressive bullish bets.
- A sustained strength beyond the $23.20 area is needed to support prospects for additional gains.
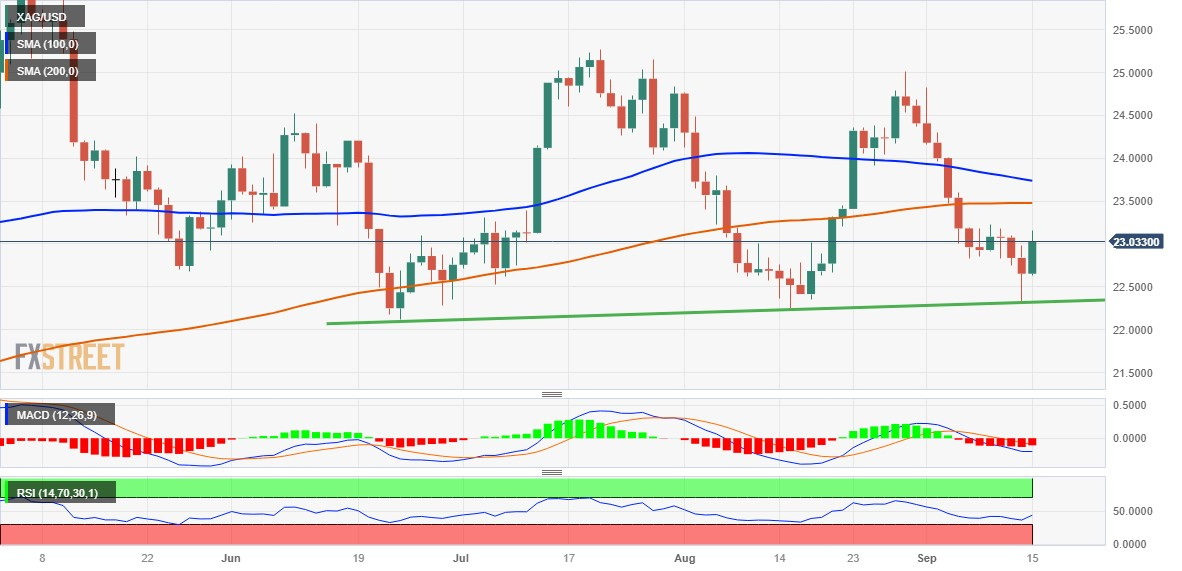
Silver builds on the previous day's bounce from the $22.30 area – support marked by an ascending trend line extending from the June swing low – and gains strong positive traction on Friday. The momentum lifts the white metal to the top end of its weekly range during the early European session, though struggles to make it through the 200-hour Simple Moving Average (SMA) resistance near the $23.15-$23.20 region.
Technical indicators on the daily chart, meanwhile, are yet to confirm a bullish bias and make it prudent to wait for a sustained strength beyond the aforementioned barrier before placing fresh bullish bets. The XAG/USD might then aim to challenge the very important 200-day SMA, currently around the $23.45 region, en route to the 100-day SMA, near the $23.80 region. This is followed by the $24.00 mark, which if cleared will set the stage for additional gains.
The next relevant hurdle is pegged near the $24.30-$24.35 region, above which the XAG/USD could aim towards reclaiming the $25.00 psychological mark. The latter coincides with the August monthly swing high and should act as a pivotal point. Some follow-through buying, leading to subsequent gains beyond the July peak, around the $25.25 region, will shift the near-term bias in favour of bullish traders and should pave the way for a further appreciating move.
On the flip side, the $22.80 area now seems to protect the immediate downside ahead of the $23.30 region, or a nearly one-month low touched on Thursday. A convincing break below will be seen as a fresh trigger for bearish traders and make the XAG/USD vulnerable to resume its downfall witnessed since the beginning of this month. The subsequent slide has the potential to drag the white metal to the next relevant support near the $21.25 zone en route to the $21.00 mark.
Silver daily chart
Technical levels to watch
Information on these pages contains forward-looking statements that involve risks and uncertainties. Markets and instruments profiled on this page are for informational purposes only and should not in any way come across as a recommendation to buy or sell in these assets. You should do your own thorough research before making any investment decisions. FXStreet does not in any way guarantee that this information is free from mistakes, errors, or material misstatements. It also does not guarantee that this information is of a timely nature. Investing in Open Markets involves a great deal of risk, including the loss of all or a portion of your investment, as well as emotional distress. All risks, losses and costs associated with investing, including total loss of principal, are your responsibility. The views and opinions expressed in this article are those of the authors and do not necessarily reflect the official policy or position of FXStreet nor its advertisers. The author will not be held responsible for information that is found at the end of links posted on this page.
If not otherwise explicitly mentioned in the body of the article, at the time of writing, the author has no position in any stock mentioned in this article and no business relationship with any company mentioned. The author has not received compensation for writing this article, other than from FXStreet.
FXStreet and the author do not provide personalized recommendations. The author makes no representations as to the accuracy, completeness, or suitability of this information. FXStreet and the author will not be liable for any errors, omissions or any losses, injuries or damages arising from this information and its display or use. Errors and omissions excepted.
The author and FXStreet are not registered investment advisors and nothing in this article is intended to be investment advice.
Recommended content
Editors’ Picks
AUD/USD holds below the 0.6400 mark ahead of the Australian CPI

The AUD/USD pair remains under selling pressure and drops below 0.6400 during the early Asian session on Wednesday. The pair is weighed by the negative sentiment and a decline in commodity prices. The pair trades around 0.6394, losing 0.03% on the day.
EUR/USD consolidates losses below 1.0600

EUR/USD extended its negative streak to six days, posting its lowest daily close since March 8 below 1.0600. The pair bottomed at 1.0561 and then rebounded timidly. The US Dollar remains firm, benefiting from risk aversion.
Gold challenges $1,900 after piercing September’s low

Spot Gold accelerated its slide on Tuesday, with XAU/USD plummeting to $1,900.83, its lowest in almost two weeks. The US Dollar surged on the back of a worsening market mood at the beginning of the week, as investors got spooked by central banks’ pledges to keep rates higher for longer and dismal United States (US) data.
Ethereum Restaking - The next big thing after liquid staking?

Ethereum introduced unstaking this year, and the crypto market witnessed a stark shift. The Decentralized Finance (DeFi) space, in particular, observed the emergence of liquid staking protocols. With the discourse of “restaking” picking up heat, it seems like the market is getting ready for the next big thing.
Australia Monthly CPI Preview: Inflation expected to rebound in August

The Australian Monthly Consumer Price Index (CPI) inflation data for August will be published by the Australian Bureau of Statistics (ABS) on Wednesday at 01:30 GMT. The data could be critical for the Australian Dollar (AUD) and the Reserve Bank of Australia (RBA).