|

Silver Price Analysis: XAG/USD soars above key resistance as buyers’ eye $29.00

  • Silver rallies, gaining nearly $1.00 to pass $28.00, fueled by falling US Treasury yields and a weaker dollar.
  • Bullish technicals as RSI exceeds 60, indicating room for more upward movement.
  • Resistance levels at $28.49 and $29.00, targeting year-to-date high of $29.79; support at $28.00 and $27.70.

Silver prices rallied sharply as US Treasury yields tumbled, and the Greenback weakened as major central banks opened the door to ease policy. At the time of writing, XAG-USD trades at $28.29, up by more than 3.50%.

XAG/USD Price Analysis: Technical outlook

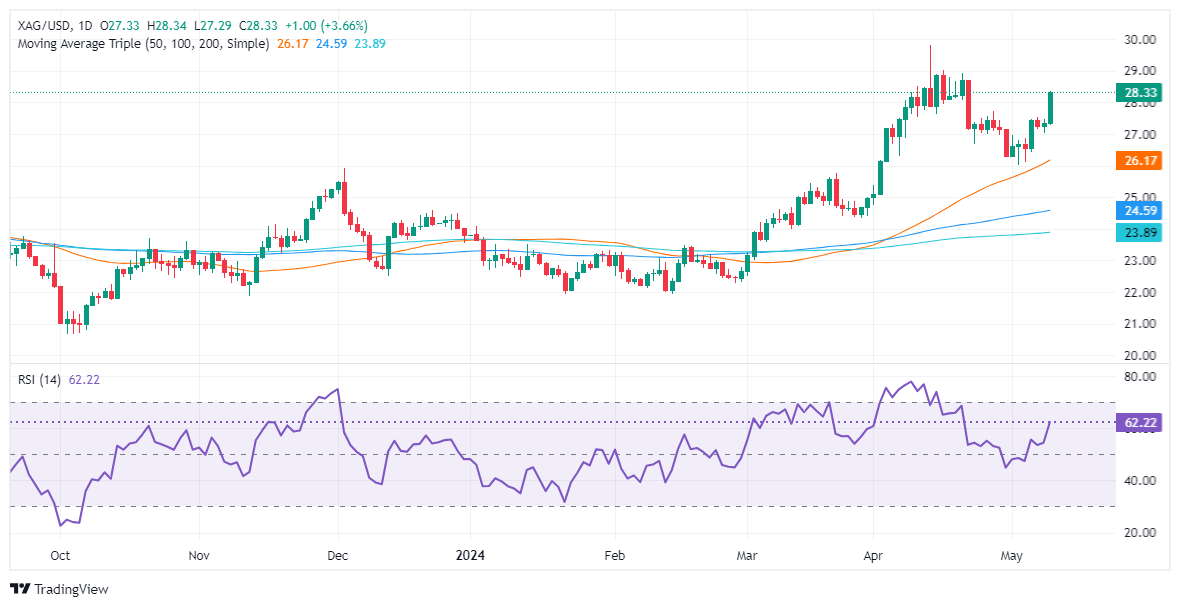
After consolidating below the latest cycle high of $27.733 witnessed on April 26, the grey metal exploded with close to $1.00 gains, clearing the $28.00 threshold, with bulls eyeing the $28.50 mark.

As wrote on May 8, “The Relative Strength Index (RSI) is in bullish territory, indicating that momentum favors bulls,” This means, the precious metal could be headed for further gains, as the RSI just punched above the 60.00 threshold with enough room before turning overbought.

If buyers reclaim the 23.6% Fib retracement at $28.49, that could pave the way to test $29.00. Once cleared, the next stop would be the year-to-date (YTD) high of $29.79, followed by the $30.00 figure.

On the flip side, if sellers drag Silver below $28.00, the immediate support would be the 38.2% Fib retracement at $27.70, followed by the 50% Fib retracement at $27.05. Once those levels are cleared, up next is the psychological $27.00 figure.

XAG/USD Price Action – Daily Chart

XAG/USD

Overview
Today last price28.33
Today Daily Change1.00
Today Daily Change %3.66
Today daily open27.33
 
Trends
Daily SMA2027.5
Daily SMA5026.06
Daily SMA10024.55
Daily SMA20023.87
 
Levels
Previous Daily High27.48
Previous Daily Low27.01
Previous Weekly High27.44
Previous Weekly Low26.02
Previous Monthly High29.8
Previous Monthly Low24.75
Daily Fibonacci 38.2%27.3
Daily Fibonacci 61.8%27.19
Daily Pivot Point S127.07
Daily Pivot Point S226.81
Daily Pivot Point S326.6
Daily Pivot Point R127.54
Daily Pivot Point R227.74
Daily Pivot Point R328.01

Author

Christian Borjon Valencia

Markets analyst, news editor, and trading instructor with over 14 years of experience across FX, commodities, US equity indices, and global macro markets.

More from Christian Borjon Valencia
Share:

Editor's Picks

EUR/USD appears supported by the 200-day SMA, for now

Following an early pullback to multi-week lows near 1.1670, EUR/USD now manages to reclaim the 1.1700 region as the NA session draws to a close on Monday. The steep retracement in spot follows the equally strong move higher in the US Dollar, as investors continue to assess the geopolitical landscape in the wake of the US and Israel attacks on Iran.


GBP/USD hits new yearly lows near 1.3300

GBP/USD adds to the recent bearish tone, approaching to the key 1.3300 support to reach fresh YTD troughs against the backdrop of the robust performance of the US Dollar. Indeed, Cable’s decline comes amid the firm demand for the safe-haven space in the wake of the US and Israel attacks to Iran.

Gold eases some ground, approaches $5,300

Gold now surrenders part of the earlier advance, reshifting its attenton to the $5,300 zone per troy ounce at the beginning of the week. Indeed, the yellow metal’s firm performance appears propped up by incresing geopolitical jitters in the Middle East, which at the same time fuels the demand for the safe-haven space.

Strategy lifts holdings to 3.4% of Bitcoin's total supply amid inflows into crypto products

Strategy continued its accumulation of the top crypto last week, acquiring 3,015 BTC for $204 million amid renewed interest in crypto products after four weeks of outflows.

The Fed is finally talking about AI – Here's why it matters for the US Dollar

AI is moving from earnings calls into the heart of monetary policy discussions, forcing Federal Reserve officials to confront a new question: How to act if AI reshapes inflation, employment and interest rates at the same time?

Grass 20% bullish breakout defies broader market weakness

Grass (GRASS) is edging up above $0.30 at the time of writing on Monday. The token’s notable 20% intraday surge stands out amid heightened volatility in the broader crypto market.