|

Silver Price Analysis: XAG/USD slumps to six-week lows amidst higher US T-bond yields

  • Silver prices slide as US retail sales data spur a jump in US Treasury bond yields, driving XAG/USD down to six-week lows around $23.64.
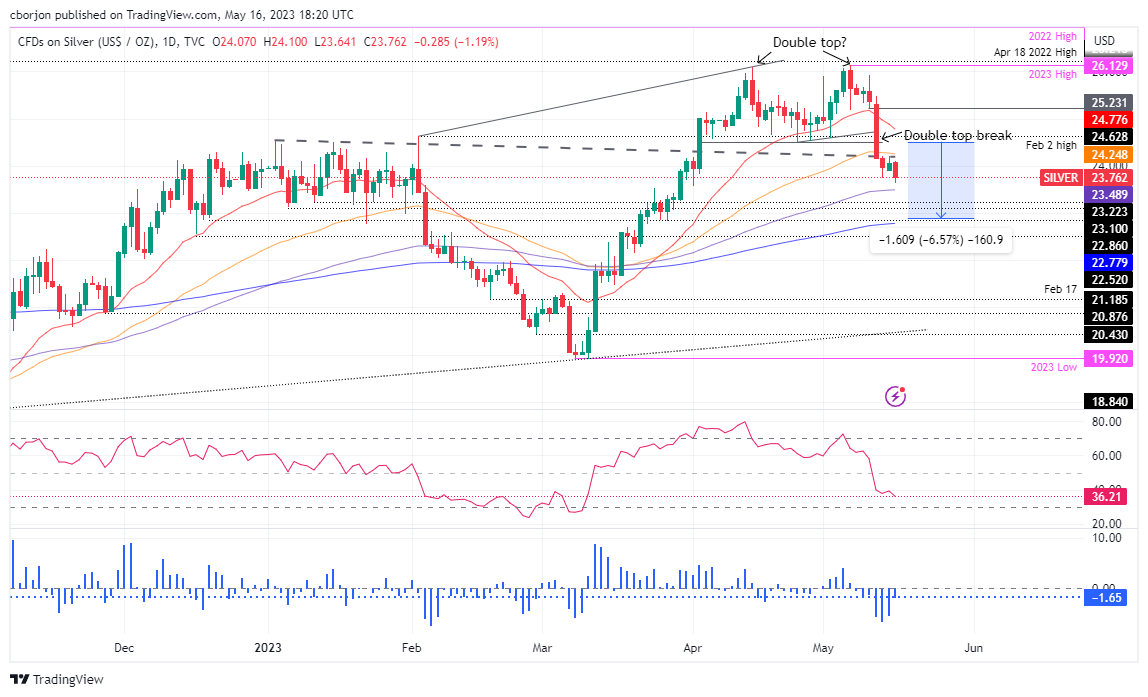
  • Technical outlook shows a double-top chart pattern with XAG/USD between 50 and 100-day EMAs, while a bearish RSI suggests further declines may be imminent.
  • XAG/USD could target the $22.90 level if the 100-day EMA is breached, while reclaiming the $24.00 figure could pave the way for a rally toward the 50-day EMA and potentially $25.00.

Silver price continues to validate a double-top formation, falls to fresh six-week lows around $23.64, shy of testing the 100-day Exponential Moving Average (EMA) at $23.48. Factors like US Retails Sales improving in April spurred a jump in US Treasury bond yields, a headwind for the white metal. Therefore, the XAG/USD is trading at $23.73 after reaching a daily high of $24.10.

XAG/USD Price Analysis: Technical outlook

A double-top chart pattern remains as the XAG/USD continued to slide, sitting between the 50 and 100-day EMAs, each at $24.24 and $23.48, respectively. The Relative Strength Index (RSI) indicator at bearish territory suggests Silver’s fall could continue in the near term, but the 3-day Rate of Change (RoC) has begun to show that sellers are losing momentum.

If XAG/USD cracks the 100-day EMA, that will exacerbate a fall toward the $23.00 a troy ounce figure before sellers can reach the double-top’s objective to fall toward $22.90, shy of testing the 200-day EMA at $22.77.

On the other hand, if XAG/USD reclaims the $24.00 figure, that could exert upward pressure on the XAG/USD and open the door to test the 50-day EMA. A breach of the latter will expose the February 2 high at $24.63 before challenging the $25.00 psychological figure.

XAG/USD Price Action – Daily chart

XAG/USD

Overview
Today last price23.76
Today Daily Change-0.33
Today Daily Change %-1.37
Today daily open24.09
 
Trends
Daily SMA2025.12
Daily SMA5023.93
Daily SMA10023.39
Daily SMA20021.87
 
Levels
Previous Daily High24.21
Previous Daily Low23.88
Previous Weekly High25.92
Previous Weekly Low23.74
Previous Monthly High26.09
Previous Monthly Low23.57
Daily Fibonacci 38.2%24.08
Daily Fibonacci 61.8%24.01
Daily Pivot Point S123.91
Daily Pivot Point S223.73
Daily Pivot Point S323.58
Daily Pivot Point R124.24
Daily Pivot Point R224.39
Daily Pivot Point R324.57

Author

Christian Borjon Valencia

Christian Borjon began his career as a retail trader in 2010, mainly focused on technical analysis and strategies around it. He started as a swing trader, as he used to work in another industry unrelated to the financial markets.

More from Christian Borjon Valencia
Share:

Markets move fast. We move first.

Orange Juice Newsletter brings you expert driven insights - not headlines. Every day on your inbox.

By subscribing you agree to our Terms and conditions.

Editor's Picks

EUR/USD moves sideways below 1.1800 on Christmas Eve

EUR/USD struggles to find direction and trades in a narrow channel below 1.1800 after posting gains for two consecutive days. Bond and stock markets in the US will open at the usual time and close early on Christmas Eve, allowing the trading action to remain subdued. 

GBP/USD keeps range around 1.3500 amid quiet markets

GBP/USD keeps its range trade intact at around 1.3500 on Wednesday. The Pound Sterling holds the upper hand over the US Dollar amid pre-Christmas light trading as traders move to the sidelines heading into the holiday season. 

Gold retreats from record highs, trades below $4,500

Gold retreats after setting a new record-high above $4,520 earlier in the day and trades in a tight range below $4,500 as trading volumes thin out ahead of the Christmas break. The US Dollar selling bias remains unabated on the back of dovish Fed expectations, which continues to act as a tailwind for the bullion amid persistent geopolitical risks.

Bitcoin slips below $87,000 as ETF outflows intensify, whale participation declines

Bitcoin price continues to trade around $86,770 on Wednesday, after failing to break above the $90,000 resistance. US-listed spot ETFs record an outflow of $188.64 million on Tuesday, marking the fourth consecutive day of withdrawals.

Economic outlook 2026-2027 in advanced countries: Solidity test

After a year marked by global economic resilience and ending on a note of optimism, 2026 looks promising and could be a year of solid economic performance. In our baseline scenario, we expect most of the supportive factors at work in 2025 to continue to play a role in 2026.

Avalanche struggles near $12 as Grayscale files updated form for ETF

Avalanche trades close to $12 by press time on Wednesday, extending the nearly 2% drop from the previous day. Grayscale filed an updated form to convert its Avalanche-focused Trust into an ETF with the US Securities and Exchange Commission.