|

Silver Price Analysis: XAG/USD seems vulnerable near one-month low, bears flirt with 50 DMA

  • Silver drifts lower for the third successive day and hits over a one-month low on Friday.
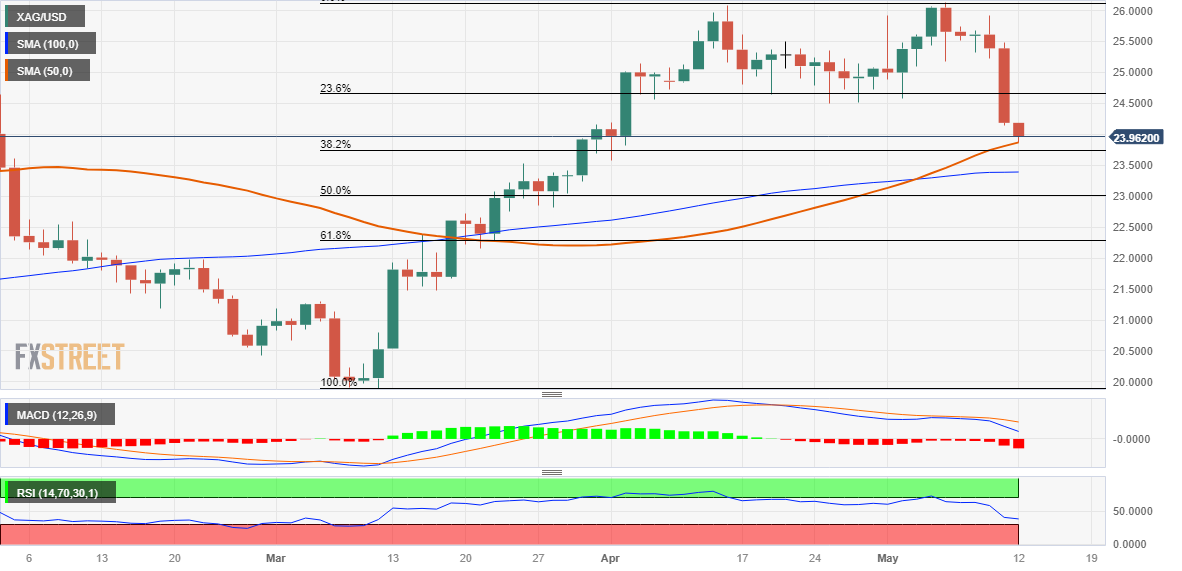
  • The overnight breakthrough the $24.50-40 horizontal support favours bearish traders.
  • Some follow-through selling below the 38.2% Fibo. will set the stage for deeper losses.

Silver remains under some selling pressure for the third successive day on Friday and drops to sub-$24.00 levels, or over a one-month low heading into the European session.

From a technical perspective, the recent repeated failures near the $26.00 round-figure mark and the subsequent steep break through the $24.50-$24.40 strong horizontal support favours bearish traders. Moreover, oscillators on the daily chart are holding deep in the negative territory and are still far from being in the oversold zone. This might have already set the stage for a further near-term depreciating move for the XAG/USD.

The white metal, however, manages to find some support near the 50-day Simple Moving Average (SMA). This is followed by the 38.2% Fibonacci retracement level of the March-April rally, around the $23.75-$23.70 area, which if broken will reaffirm the negative bias. The XAG/USD might then test the 100-day SMA, currently pegged near the $23.40-$23.45 area, before eventually dropping to the 50% Fibo. level, around the $23.00 mark.

On the flip side, any meaningful recovery attempt might now confront stiff resistance near the $24.40-$24.50 support breakpoint, which coincides with the 23.6% Fibo. level. A sustained strength beyond could negate the bearish outlook and lift the XAG/USD to the $25.00 psychological mark en route to the $25.55-$25.60 resistance. Bulls might then make a fresh attempt to conquer the $26.00 mark and test the YTD peak, around the $26.10-$26.15 area.

Silver daily chart

fxsoriginal

Key levels to watch

XAG/USD

Overview
Today last price23.97
Today Daily Change-0.22
Today Daily Change %-0.91
Today daily open24.19
 
Trends
Daily SMA2025.24
Daily SMA5023.81
Daily SMA10023.39
Daily SMA20021.83
 
Levels
Previous Daily High25.48
Previous Daily Low24.14
Previous Weekly High26.14
Previous Weekly Low24.58
Previous Monthly High26.09
Previous Monthly Low23.57
Daily Fibonacci 38.2%24.65
Daily Fibonacci 61.8%24.97
Daily Pivot Point S123.72
Daily Pivot Point S223.26
Daily Pivot Point S322.39
Daily Pivot Point R125.06
Daily Pivot Point R225.94
Daily Pivot Point R326.4

Author

Haresh Menghani

Haresh Menghani is a detail-oriented professional with 10+ years of extensive experience in analysing the global financial markets.

More from Haresh Menghani
Share:

Markets move fast. We move first.

Orange Juice Newsletter brings you expert driven insights - not headlines. Every day on your inbox.

By subscribing you agree to our Terms and conditions.

Editor's Picks

EUR/USD recovers to 1.1750 region as 2025 draws to a close

Following the bearish action seen in the European session on Wednesday, EUR/USD regains its traction and recovery to the 1.1750 region. Nevertheless, the pair's volatility remains low as trading conditions thin out on the last day of the year.

GBP/USD stays weak near 1.3450 on modest USD recovery

GBP/USD remains under modest beairsh pressure and fluctuates at around 1.3450 on Wednesday. The US Dollar finds fresh demand due to the end-of-the-year position adjustments, weighing on the pair amid the pre-New Year trading lull. 

Gold retreats to $4,300 area, looks to post monthly gains

Gold stays on the back foot on the last day of 2025 and trades near $4,300, possibly pressured by profit-taking and position adjustments. Nevertheless, XAU/USD remains on track to post gains for December and extend its winning streak into a fifth consecutive month.

Bitcoin, Ethereum and XRP prepare for a potential New Year rebound

Bitcoin, Ethereum, and Ripple are holding steady on Wednesday after recording minor gains on the previous day. Technically, Bitcoin could extend gains within a triangle pattern while Ethereum and Ripple face critical overhead resistance. 

Economic outlook 2026-2027 in advanced countries: Solidity test

After a year marked by global economic resilience and ending on a note of optimism, 2026 looks promising and could be a year of solid economic performance. In our baseline scenario, we expect most of the supportive factors at work in 2025 to continue to play a role in 2026.

Crypto market outlook for 2026

Year 2025 was volatile, as crypto often is.  Among positive catalysts were favourable regulatory changes in the U.S., rise of Digital Asset Treasuries (DAT), adoption of AI and tokenization of Real-World-Assets (RWA).