|

Silver Price Analysis: XAG/USD seems vulnerable near $22.30, two-week low

  • Silver loses ground for the third straight day and drops to over a two-week low.
  • The technical setup favours bears and supports prospects for additional losses.
  • A sustained move above the 200-day SMA is needed to negate the negative bias.

Silver (XAG/USD) remains under heavy selling pressure for the third successive day on Wednesday – also marking the fifth day of a negative move in the previous six and drops to over a two-week low during the first half of the European session. The white metal currently trades around the $22.30 region and seems vulnerable to prolonging its recent downfall witnessed over the past two weeks or so.

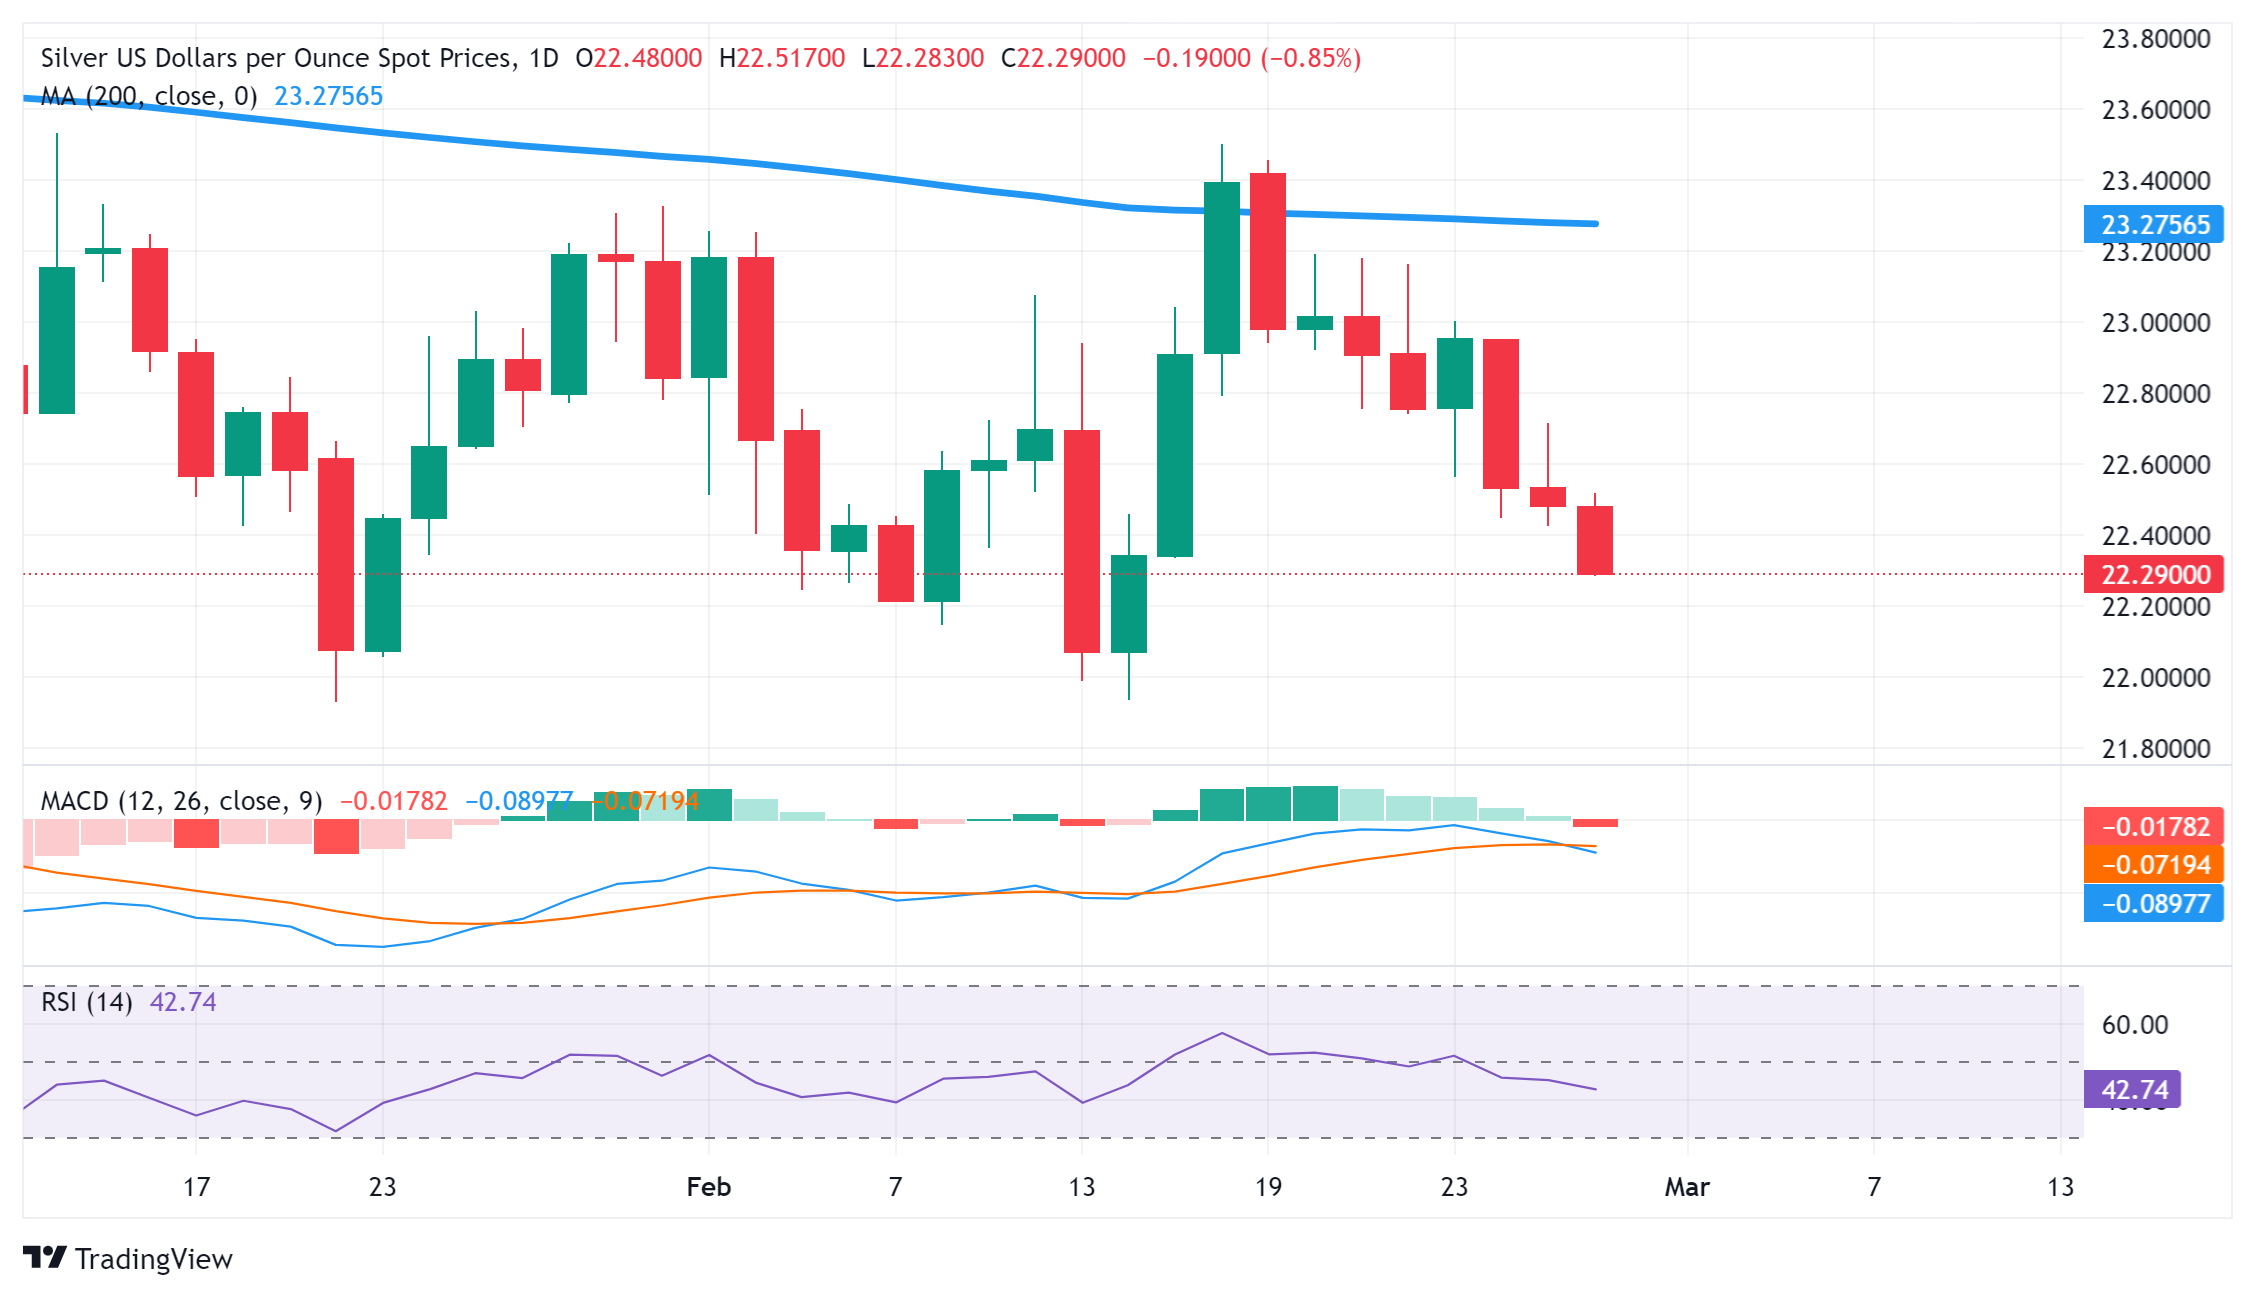
From a technical perspective, the recent failure to find acceptance above the very important and significant 200-day Simple Moving Average (SMA) and the subsequent decline validate the near-term negative outlook. Moreover, oscillators on the daily chart have just started gaining negative traction and further suggest that the path of least resistance for the XAG/USD remains to the downside.

Hence, some follow-through weakness towards retesting sub-$22.00 levels, or the two-month low touched in January, looks like a distinct possibility. A convincing break below the latter will be seen as a fresh trigger for bearish traders and pave the way for additional losses, dragging the XAG/USD towards the $21.40-$21.35 support zone.

On the flip side, the daily swing high, around the mid-$22.00s, now seems to act as an immediate hurdle ahead of the $22.70-$22.75 region. This is closely followed by the $23.00 round figure, which if cleared decisively might trigger a short-covering rally, though is likely to attract fresh sellers near the 200-day SMA, currently pegged around the $23.30 zone, and remain capped near mid-$23.00, or the monthly peak.

Silver daily chart

fxsoriginal

XAG/USD

Overview
Today last price22.3
Today Daily Change-0.18
Today Daily Change %-0.80
Today daily open22.48
 
Trends
Daily SMA2022.7
Daily SMA5023.04
Daily SMA10023.21
Daily SMA20023.28
 
Levels
Previous Daily High22.72
Previous Daily Low22.42
Previous Weekly High23.46
Previous Weekly Low22.56
Previous Monthly High24.09
Previous Monthly Low21.93
Daily Fibonacci 38.2%22.53
Daily Fibonacci 61.8%22.6
Daily Pivot Point S122.36
Daily Pivot Point S222.25
Daily Pivot Point S322.07
Daily Pivot Point R122.66
Daily Pivot Point R222.83
Daily Pivot Point R322.95

Author

Haresh Menghani

Haresh Menghani is a detail-oriented professional with 10+ years of extensive experience in analysing the global financial markets.

More from Haresh Menghani
Share:

Markets move fast. We move first.

Orange Juice Newsletter brings you expert driven insights - not headlines. Every day on your inbox.

By subscribing you agree to our Terms and conditions.

Editor's Picks

EUR/USD moves sideways below 1.1800 on Christmas Eve

EUR/USD struggles to find direction and trades in a narrow channel below 1.1800 after posting gains for two consecutive days. Bond and stock markets in the US will open at the usual time and close early on Christmas Eve, allowing the trading action to remain subdued. 

GBP/USD keeps range around 1.3500 amid quiet markets

GBP/USD keeps its range trade intact at around 1.3500 on Wednesday. The Pound Sterling holds the upper hand over the US Dollar amid pre-Christmas light trading as traders move to the sidelines heading into the holiday season. 

Gold retreats from record highs, trades below $4,500

Gold retreats after setting a new record-high above $4,520 earlier in the day and trades in a tight range below $4,500 as trading volumes thin out ahead of the Christmas break. The US Dollar selling bias remains unabated on the back of dovish Fed expectations, which continues to act as a tailwind for the bullion amid persistent geopolitical risks.

Bitcoin slips below $87,000 as ETF outflows intensify, whale participation declines

Bitcoin price continues to trade around $86,770 on Wednesday, after failing to break above the $90,000 resistance. US-listed spot ETFs record an outflow of $188.64 million on Tuesday, marking the fourth consecutive day of withdrawals.

Economic outlook 2026-2027 in advanced countries: Solidity test

After a year marked by global economic resilience and ending on a note of optimism, 2026 looks promising and could be a year of solid economic performance. In our baseline scenario, we expect most of the supportive factors at work in 2025 to continue to play a role in 2026.

Avalanche struggles near $12 as Grayscale files updated form for ETF

Avalanche trades close to $12 by press time on Wednesday, extending the nearly 2% drop from the previous day. Grayscale filed an updated form to convert its Avalanche-focused Trust into an ETF with the US Securities and Exchange Commission.