|

Silver Price Analysis: XAG/USD seems vulnerable, convincing break below $24.00 awaited

  • Silver comes under fresh selling pressure and reverses a part of Friday’s modest recovery gains.
  • The technical setup favours bearish traders and supports prospects for further near-term losses.
  • A sustained strength above the $25.00-$25.25 region is needed to negate the negative outlook.

Silver meets with a fresh supply on the first day of a new week and erodes a part of Friday's modest recovery gains from the vicinity of the $24.00 mark, or over a two-week low. The white metal maintains its offered tone through the early European session and currently trades around the $24.25 region, down nearly 0.50% for the day.

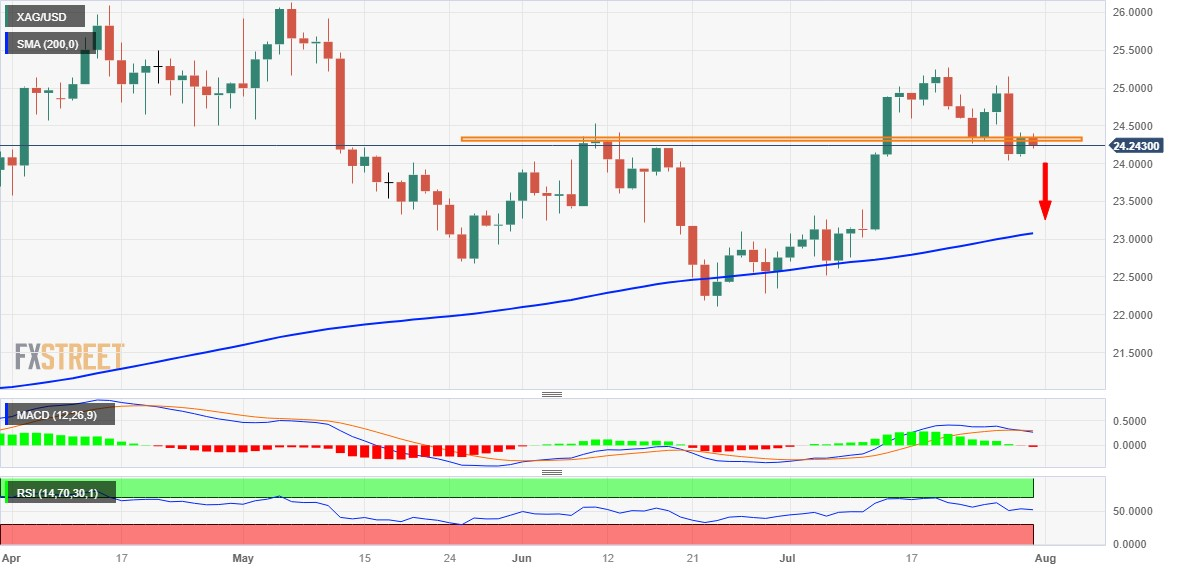
From a technical perspective, last week's failure ahead of the $25.00 psychological mark and the subsequent slump below the $24.30-$24.25 resistance-turned-support was seen as a fresh trigger for bearish traders. This, along with the emergence of fresh selling on Monday and negative oscillators on hourly charts suggest that the path of least resistance for the XAG/USD is to the downside.

That said, technical indicators on the daily chart - though have been losing traction - are yet to confirm the negative outlook. This makes it prudent to wait for a sustained break below the $24.00 mark before positioning for deeper losses. The XAG/USD might then turn vulnerable and accelerate the downfall towards testing the next relevant support near the $23.20-$23.15 area en route to the $23.00 mark.

The latter coincides with the very important 200-day Simple Moving Average (SMA), which if broken decisively should pave the way for a fall towards challenging the multi-month low, around the $22.15-$22.10 area touched in June.

On the flip side, the $24.30-$24.35 region might continue to act as an immediate hurdle ahead of the $24.60-$24.65 area. Some follow-through buying could lift the XAG/USD back to the $25.00 mark. This is followed by the monthly peak, around the $25.25 zone, which if cleared will negate the negative outlook. Silver might then surpass the $25.50-$25.55 hurdle and aim to reclaim the $26.00 mark.

Silver daily chart

fxsoriginal

Key levels to watch

XAG/USD

Overview
Today last price24.25
Today Daily Change-0.10
Today Daily Change %-0.41
Today daily open24.35
 
Trends
Daily SMA2024.09
Daily SMA5023.65
Daily SMA10023.93
Daily SMA20023.06
 
Levels
Previous Daily High24.41
Previous Daily Low24.09
Previous Weekly High25.15
Previous Weekly Low24.04
Previous Monthly High24.53
Previous Monthly Low22.11
Daily Fibonacci 38.2%24.29
Daily Fibonacci 61.8%24.21
Daily Pivot Point S124.16
Daily Pivot Point S223.97
Daily Pivot Point S323.84
Daily Pivot Point R124.48
Daily Pivot Point R224.6
Daily Pivot Point R324.79

Author

Haresh Menghani

Haresh Menghani is a detail-oriented professional with 10+ years of extensive experience in analysing the global financial markets.

More from Haresh Menghani
Share:

Editor's Picks

EUR/USD holds above 1.1750 after mixed EU PMI data

EUR/USD manages to hold above 1.1750 but struggles to gather recovery momentum on Friday, following the mixed February PMI figures from Germany and the Eurozone. In the second half of the day, Q4 GDP, December inflation and February PMI data from the US will be watched closely by market participants.

GBP/USD recovers further toward 1.3500 after UK PMI data

GBP/USD is recovering ground further toward 1.3500 in European trading on Friday, helped by a modest uptick in the Pound Sterling after stronger-than-expected UK January Retail Sales and February PMI data. However, the pair's further upside could be limited amid persistent US Dollar strength as the focus turns to key US data. 

Gold sticks to positive bias above $5,000 ahead of US data

Gold gains some positive traction for the third consecutive day on Friday. holding above $5,000. Traders now look forward to the key US macro releases – the Advance Q4 GDP report and the Personal Consumption Expenditures (PCE) Price Index – for fresh trading impetus. 

US GDP growth expected to slow down significantly in Q4 after stellar Q3 

The United States Bureau of Economic Analysis will publish the first preliminary estimate of the fourth-quarter Gross Domestic Product at 13:30 GMT. Analysts forecast the US economy to have expanded at a 3% annualized rate, slowing down from the 4.4% growth posted in the previous quarter.

Iran tensions and AI fears at the forefront ahead of key US data

Thursday’s scorecard shows major US Stock benchmarks closed modestly in the red amid mounting US-Iran tensions and AI disruption worries. The S&P 500 shed 19 points (0.3%) to 6,861, the Nasdaq 100 lost 101 points (0.4%) to 24,797, and the Dow Jones Industrial Average dropped 267 points (0.5%) to 49,395.

Official Trump price approaches breakout with mixed signals from traders

Official Trump (TRUMP) is trading at $3.50 at the time of writing, approaching its upper consolidation range. A breakout from this range could open the door for an upside move. On-chain data shows market indecision, with balanced flows between bulls and bears, signaling a lack of clear directional bias.