|

Silver Price Analysis: XAG/USD seems poised to retest sub-$20.00 levels, or YTD low set in March

  • Silver comes under some renewed selling pressure on Wednesday, albeit lacks follow-through.
  • The oversold RSI on the daily chart holds back bears from placing fresh bets around the XAG/USD.
  • The technical setup supports prospects for an extension of the recent sharp depreciating move.

Silver struggles to capitalize on the previous day's recovery move from the $20.70-$20.65 area, or its lowest level since March 13 and meets with a fresh supply on Wednesday. The white metal, however, rebounds from the daily trough touched during the early European session and currently trades around the $21.10 region, down less than 0.15% for the day.

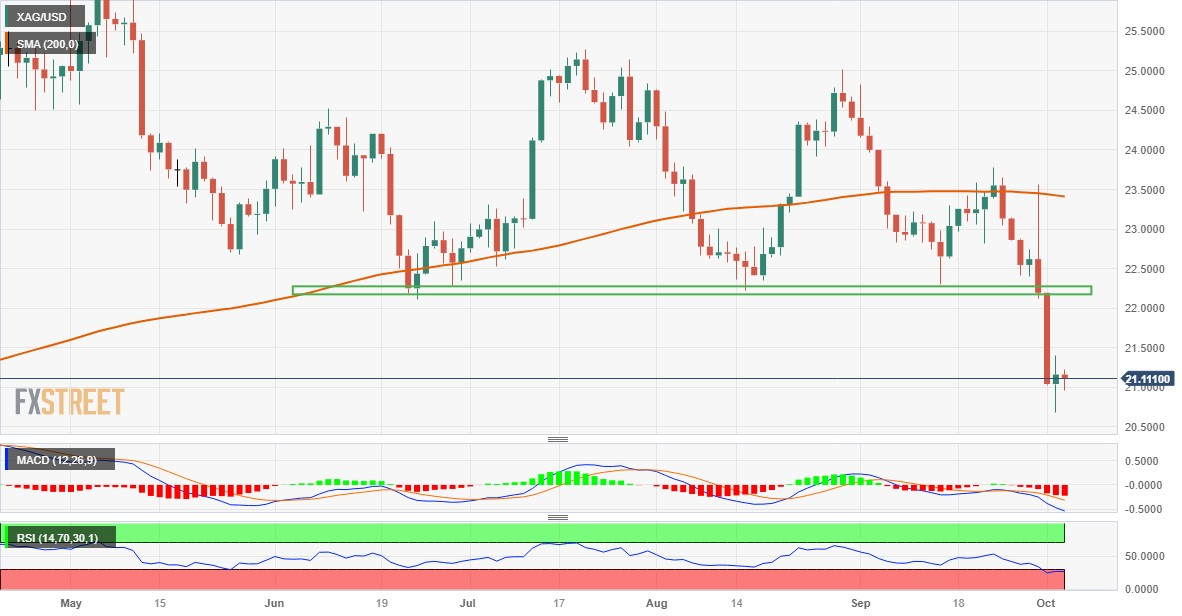
From a technical perspective, the recent breakdown through the $23.30-$23.20 horizontal support was seen as a fresh trigger for bearish traders. That said, the Relative Strength Index (RSI) on the daily chart is flashing oversold conditions. This, in turn, warrants caution and makes it prudent to wait for some near-term consolidation or a modest bounce before positioning for any further depreciating move.

Nevertheless, the XAG/USD remains vulnerable to prolong its descending trend and slide back to the $20.70-$20.65 zone, or a nearly seven-month low touched on Tuesday. The downward trajectory could get extended further towards challenging the YTD trough – levels just below the $20.00 psychological mark set in March.

On the flip side, a strength beyond the overnight swing high, around the $21.40 region, might trigger a short-covering rally and allow the XAG/USD to reclaim the $22.00 round-figure mark. Any subsequent move up might be seen as a selling opportunity and remain capped near the $22.20-$22.30 strong horizontal support breakpoint. The latter should act as a pivotal point, which if cleared might shift the bias in favour of bullish traders.

Silver daily chart

fxsoriginal

Technical levels to watch

XAG/USD

Overview
Today last price21.14
Today Daily Change-0.02
Today Daily Change %-0.09
Today daily open21.16
 
Trends
Daily SMA2022.8
Daily SMA5023.31
Daily SMA10023.46
Daily SMA20023.43
 
Levels
Previous Daily High21.39
Previous Daily Low20.68
Previous Weekly High23.65
Previous Weekly Low22.12
Previous Monthly High24.82
Previous Monthly Low22.12
Daily Fibonacci 38.2%21.12
Daily Fibonacci 61.8%20.96
Daily Pivot Point S120.76
Daily Pivot Point S220.37
Daily Pivot Point S320.06
Daily Pivot Point R121.47
Daily Pivot Point R221.79
Daily Pivot Point R322.18

Author

Haresh Menghani

Haresh Menghani is a detail-oriented professional with 10+ years of extensive experience in analysing the global financial markets.

More from Haresh Menghani
Share:

Markets move fast. We move first.

Orange Juice Newsletter brings you expert driven insights - not headlines. Every day on your inbox.

By subscribing you agree to our Terms and conditions.

Editor's Picks

EUR/USD could test 1.1750 amid strengthening bullish bias

EUR/USD remains flat after two days of small losses, trading around 1.1740 during the Asian hours on Thursday. On the daily chart, technical analysis indicates a strengthening of a bullish bias, as the pair continues to trade within an ascending channel pattern.

GBP/USD consolidates above mid-1.3300s as traders await BoE and US CPI report

The GBP/USD pair struggles to capitalize on the overnight bounce from the 1.3310 area, or a one-week low, and oscillates in a narrow band during the Asian session on Thursday. Spot prices currently trade around the 1.3370 region, down less than 0.10% for the day, as traders opt to wait on the sidelines ahead of the key central bank event risk and US consumer inflation data.

Gold awaits weekly trading range breakout ahead of US CPI report

Gold struggles to capitalize on the previous day's move higher back closer to the $4,350 level and trades with a mild negative bias during the Asian session on Thursday. The downtick could be attributed to some profit-taking amid a US Dollar uptick, though it is likely to remain cushioned on the back of a supportive fundamental backdrop. 

Dogecoin breaks key support amid declining investor confidence

Dogecoin trades in the red on Thursday, following a 4% decline on the previous day. The DOGE supply in profit declines as large wallet investors trim their portfolios. Derivatives data shows a surge in bearish positions amid declining retail interest.

Monetary policy: Three central banks, three decisions, the same caution

While the Fed eased its monetary policy on 10 December for the third consecutive FOMC meeting, without making any guarantees about future action, the BoE, the ECB and the BoJ are holding their respective meetings this week. 

Dogecoin Price Forecast: DOGE breaks key support amid declining investor confidence

Dogecoin (DOGE) trades in the red on Thursday, following a 4% decline on the previous day. The DOGE supply in profit declines as large wallet investors trim their portfolios. Derivatives data shows a surge in bearish positions amid declining retail interest.