|

Silver Price Analysis: XAG/USD rises and tests ‘double top’ neckline around $30.00

  • Silver climbs to $29.98, gaining 1.69%, supported by weaker-than-expected US jobs data.
  • Technical outlook shows a double top pattern, indicating potential for further losses.
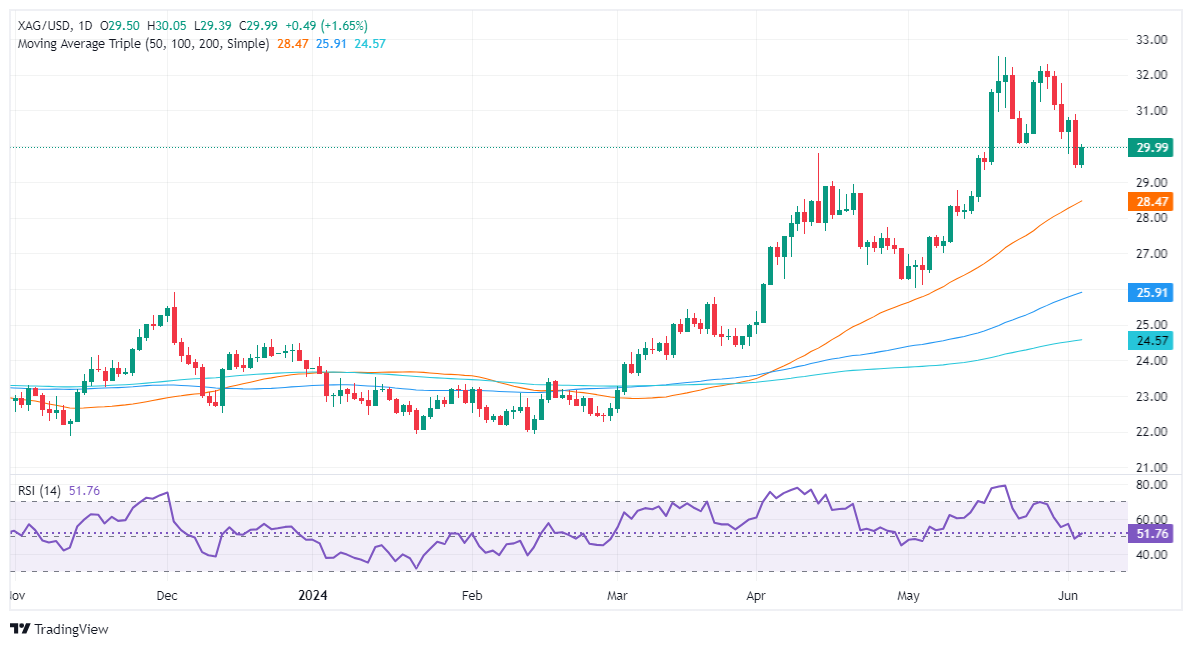
  • Key levels to watch: Resistance at $30.05; support at $29.79, $29.00, $28.74, $28.34, and the double top objective at $27.80.

Silver recovered some ground on Wednesday as US Treasury bond yields plunged due to weaker-than-expected US jobs data. At the time of writing, the XAG/USD trades at $29.98 and gains 1.69%.

XAG/USD Price Analysis: Technical outlook

A double top chart pattern emerged in Silver’s daily chart, opening the door for further losses. Although the grey metal climbed toward the May 24 low, turning resistance at $30.05, buyers are struggling to reclaim $30.00, paving the way for further downside.

If the XAG/USD falls below the latest cycle high seen on April 12 at $29.79, that would open the door to challenging $29.00. A breach of the latter will expose previous key resistance levels that turned support, like the May 18, 2021, high of $28.74, followed by the June 10, 2021, high of $28.34. Up next would be the ‘double top’ objective at $27.80.

XAG/USD Price Action – Daily Chart

XAG/USD

Overview
Today last price30
Today Daily Change0.50
Today Daily Change %1.69
Today daily open29.5
 
Trends
Daily SMA2030.21
Daily SMA5028.35
Daily SMA10025.84
Daily SMA20024.55
 
Levels
Previous Daily High30.89
Previous Daily Low29.38
Previous Weekly High32.3
Previous Weekly Low30.19
Previous Monthly High32.51
Previous Monthly Low26.02
Daily Fibonacci 38.2%29.96
Daily Fibonacci 61.8%30.31
Daily Pivot Point S128.96
Daily Pivot Point S228.41
Daily Pivot Point S327.44
Daily Pivot Point R130.47
Daily Pivot Point R231.44
Daily Pivot Point R331.98

Author

Christian Borjon Valencia

Markets analyst, news editor, and trading instructor with over 14 years of experience across FX, commodities, US equity indices, and global macro markets.

More from Christian Borjon Valencia
Share:

Editor's Picks

AUD/USD eyes 0.7150 barrier nine-day EMA

AUD/USD inches higher after registering modest losses in the previous day, trading around 0.7130 during the Asian hours. The technical analysis of the daily chart indicates that the pair is moving sideways within the rectangle pattern, suggesting a consolidation as neither the bulls nor the bears have enough momentum to take control of the market.

USD/JPY trades below 160.00 intervention threshold; bullish bias intact

The USD/JPY pair attracts some sellers during the Asian session amid fears that authorities will step in again to prop up the Japanese Yen. Furthermore, the Israel-Lebanon truce prompts some profit-taking around the US Dollar and exerts downward pressure on the currency pair.

Gold puts its 200-day SMA to the test near $4,420

Gold keeps the bullish stance in place in the latter part of Thursday’s session, although a convincing break above the key $4,500 mark per troy ounce still remains elusive. The precious metal’s advance comes amid the resurgence of some selling interest around the Greenback, improving risk sentiment, and declining US Treasury yields across the board.

Bitcoin’s massive storm is back: Why the sell-off is far from over

Bitcoin price action over the last few weeks has felt less like a normal, healthy correction and more like a slow grinding crash that continues to wreak havoc on holdings and trading accounts. And everything suggests that the dramatic crash isn’t over.

Nonfarm payrolls: Testing the limits of Fed policy patience

The upcoming nonfarm payrolls report for May will provide the final update on the US labor market before Kevin Warsh attends his first policy meeting as the new Fed Chair later this month.

Recession on paper: What really moves the Canadian Loonie now?

Statistics Canada handed the headline writers a gift and the analysts a headache. Real GDP shrank 0.1% on an annualized basis in the first quarter, and with the fourth quarter of 2025 revised down to a 1.0% contraction, that is two negative quarters in a row, the textbook definition of a technical recession and Canada's first since the pandemic.