|

Silver Price Analysis: XAG/USD retreats further from $23.60-70 barrier/multi-week top

  • Silver snaps a three-day winning streak to a near four-week high touched on Wednesday.
  • The technical setup seems tilted in favour of bulls and should help limit any further losses.
  • Bulls still need to wait for a move beyond the $23.60-70 barrier before placing fresh bets.

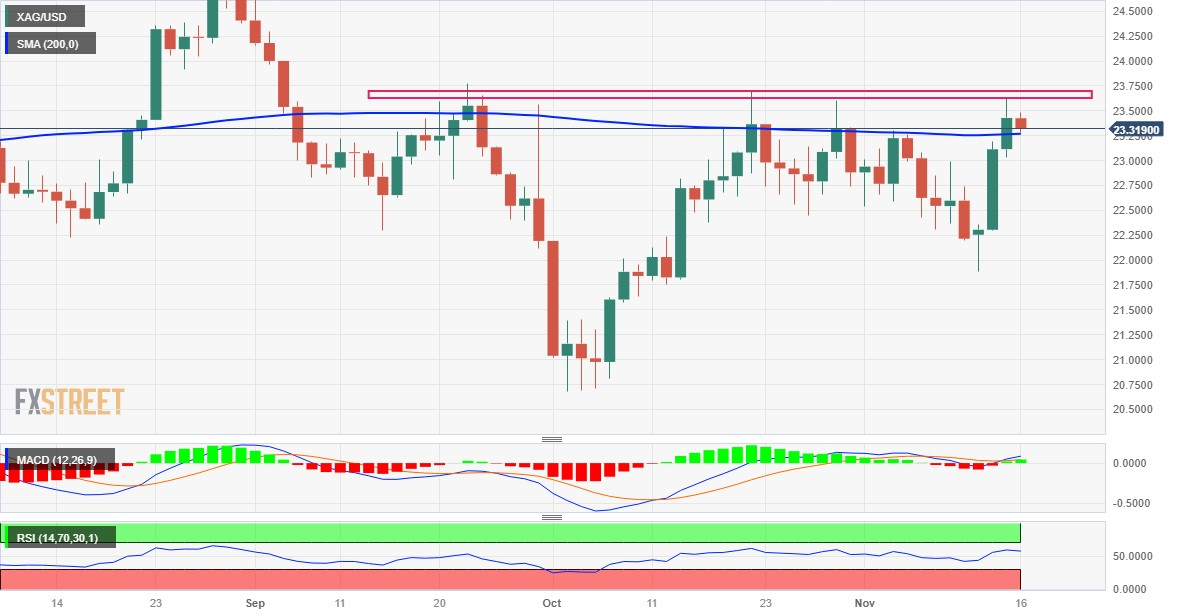
Silver (XAG/USD) meets with some supply during the Asian session on Thursday and moves further away from a near four-week high touched the previous day. The white metal currently trades around the $23.30 area, down over 0.50% for the day, and for now, seems to have snapped a three-day winning streak.

From a technical perspective, the overnight close above the very important 200-day Simple Moving Average (SMA) could be seen as a fresh trigger for bullish traders. Moreover, oscillators on the daily chart have just started gaining positive traction and add credence to the constructive outlook. That said, failure to break through the $23.60-$23.70 horizontal barrier prompts some long-unwinding on Thursday.

Hence, it will be prudent to wait for strong follow-through buying and acceptance above the aforementioned hurdle before positioning for an extension of this week's bounce from sub-$22.00 levels, or the monthly low. The XAG/USD might then climb further towards reclaiming the $24.00 mark en route to the $24.20-$24.25 intermediate resistance, before making a fresh attempt to conquer the $25.00 psychological mark.

On the flip side, any further decline below the $23.00 mark could attract fresh buying and remain limited near the $22.35-$22.30 area, This is followed by the $22.00 mark, which if broken decisively will shift the near-term bias back in favour of bearish traders. Some follow-through selling below the $21.85 region, or the monthly low, will reaffirm the negative outlook and drag the XAG/USD towards the $21.35-$21.30 support.

The downward trajectory could get extended further below the $21.00 round figure, towards challenging the multi-month low, around the $20.70-$20.65 area touched in October.

Silver daily chart

fxsoriginal

Technical levels to watch

XAG/USD

Overview
Today last price23.32
Today Daily Change-0.11
Today Daily Change %-0.47
Today daily open23.43
 
Trends
Daily SMA2022.9
Daily SMA5022.66
Daily SMA10023.19
Daily SMA20023.27
 
Levels
Previous Daily High23.62
Previous Daily Low23.03
Previous Weekly High23.26
Previous Weekly Low22.19
Previous Monthly High23.7
Previous Monthly Low20.68
Daily Fibonacci 38.2%23.4
Daily Fibonacci 61.8%23.26
Daily Pivot Point S123.1
Daily Pivot Point S222.77
Daily Pivot Point S322.51
Daily Pivot Point R123.69
Daily Pivot Point R223.95
Daily Pivot Point R324.28

Author

Haresh Menghani

Haresh Menghani is a detail-oriented professional with 10+ years of extensive experience in analysing the global financial markets.

More from Haresh Menghani
Share:

Markets move fast. We move first.

Orange Juice Newsletter brings you expert driven insights - not headlines. Every day on your inbox.

By subscribing you agree to our Terms and conditions.

Editor's Picks

EUR/USD retreats below 1.1750 on modest USD recovery

EUR/USD stays under modest bearish pressure and trades below 1.1750 on Friday. Although trading conditions remain thin following the New Year holiday and ahead of the weekend, the modest recovery seen in the US Dollar causes the pair to edge lower. The economic calendar will not feature any high-impact data releases.

GBP/USD struggles to gain traction, stabilizes above 1.3450

After testing 1.3400 on the last day of 2025, GBP/USD managed to stage a rebound. Nevertheless, the pair finds it difficult to gather momentum and moves sideways above 1.3450 as market participants remain in holiday mood.

Gold climbs toward $4,400 following deep correction

Gold reverses its direction and advances toward $4,400 after suffering heavy losses amid profit-taking before the New Year holiday. Growing expectations for a dovish Fed policy and persistent geopolitical risks seem to be helping XAU/USD stretch higher.

Cardano gains early New Year momentum, bulls target falling wedge breakout

Cardano kicks off the New Year on a positive note and is extending gains, trading above $0.36 at the time of writing on Friday. Improving on-chain and derivatives data point to growing bullish interest, while the technical outlook keeps an upside breakout in focus.

Economic outlook 2026-2027 in advanced countries: Solidity test

After a year marked by global economic resilience and ending on a note of optimism, 2026 looks promising and could be a year of solid economic performance. In our baseline scenario, we expect most of the supportive factors at work in 2025 to continue to play a role in 2026.

Crypto market outlook for 2026

Year 2025 was volatile, as crypto often is.  Among positive catalysts were favourable regulatory changes in the U.S., rise of Digital Asset Treasuries (DAT), adoption of AI and tokenization of Real-World-Assets (RWA).