|

Silver Price Analysis: XAG/USD retreats after climbing to the highest level since February 25

  • Silver stalled its intraday positive move near a resistance marked by 61.8% Fibo. level.
  • Slightly overbought RSI on hourly charts seemed to have prompted some profit-taking.
  • The set-up supports prospects for the emergence of some dip-buying at lower levels.

Silver faded the post-NFP spike to the highest level since February 25 and dropped to fresh daily lows, around the $27.15 region in the last hour.

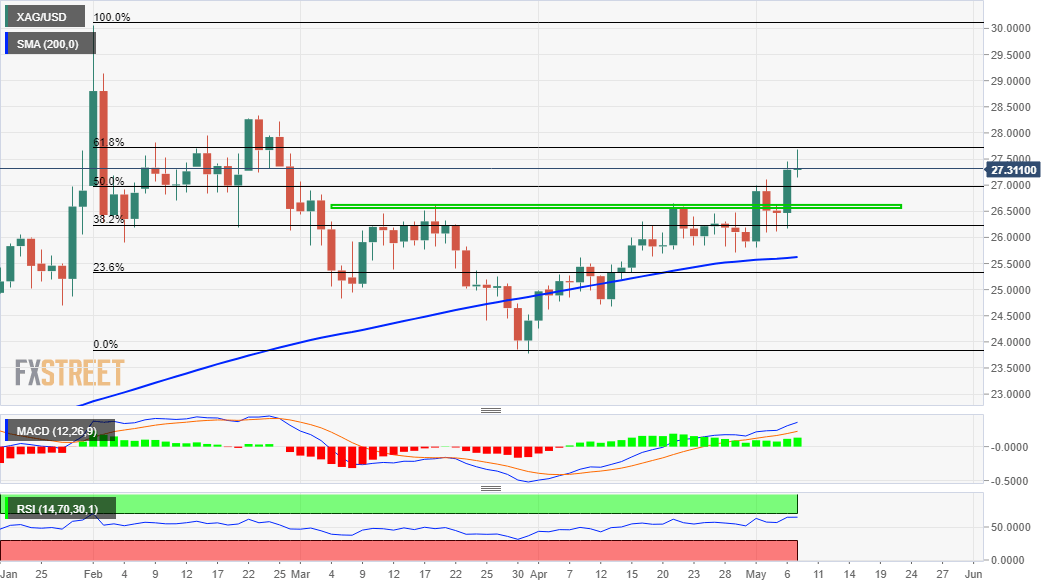
The intraday positive move stalled near the $27.65-70 region – a resistance marked by the 61.8% Fibonacci level of the $30.07-$23.78 downfall. This is followed by the $28.00 round-figure mark, which should now act as a key pivotal point for short-term traders.

Meanwhile, a modest US dollar rebound from one-week lows was seen as a key factor that prompted some profit-taking around the XAG/USD amid slightly overbought RSI on hourly charts. Hence, any subsequent fall might still be seen as an opportunity for bullish traders.

From current levels, the 50% Fibo. level, around the $26.95-90 area might protect the immediate downside. This is followed by the $26.60-50 strong horizontal resistance breakpoint, which if broken might accelerate the corrective slide to the $26.00 round figure.

The latter coincides with the 38.2% Fibo. level and should act as a strong near-term base for the XAG/USD. That said, a convincing break below will negate any near-term bullish bias, rather prompt some aggressive technical selling and turn the commodity vulnerable.

On the flip side, the daily swing highs, around the $27.65-70 area now seems to act as an immediate resistance ahead of the $28.00 mark. Some follow-through buying should pave the way for a move towards the $28.80-85 supply zone before the XAG/USD reclaims the $29.00 mark.

XAG/USD daily chart

fxsoriginal

Techical levels to watch

XAG/USD

Overview
Today last price27.27
Today Daily Change-0.03
Today Daily Change %-0.11
Today daily open27.3
 
Trends
Daily SMA2026.05
Daily SMA5025.79
Daily SMA10026.11
Daily SMA20025.61
 
Levels
Previous Daily High27.46
Previous Daily Low26.18
Previous Weekly High26.48
Previous Weekly Low25.71
Previous Monthly High26.64
Previous Monthly Low24.25
Daily Fibonacci 38.2%26.97
Daily Fibonacci 61.8%26.67
Daily Pivot Point S126.49
Daily Pivot Point S225.69
Daily Pivot Point S325.21
Daily Pivot Point R127.78
Daily Pivot Point R228.26
Daily Pivot Point R329.06

Author

Haresh Menghani

Haresh Menghani is a detail-oriented professional with 10+ years of extensive experience in analysing the global financial markets.

More from Haresh Menghani
Share:

Markets move fast. We move first.

Orange Juice Newsletter brings you expert driven insights - not headlines. Every day on your inbox.

By subscribing you agree to our Terms and conditions.

Editor's Picks

EUR/USD moves sideways below 1.1800 on Christmas Eve

EUR/USD struggles to find direction and trades in a narrow channel below 1.1800 after posting gains for two consecutive days. Bond and stock markets in the US will open at the usual time and close early on Christmas Eve, allowing the trading action to remain subdued. 

GBP/USD keeps range around 1.3500 amid quiet markets

GBP/USD keeps its range trade intact at around 1.3500 on Wednesday. The Pound Sterling holds the upper hand over the US Dollar amid pre-Christmas light trading as traders move to the sidelines heading into the holiday season. 

Gold retreats from record highs, trades below $4,500

Gold retreats after setting a new record-high above $4,520 earlier in the day and trades in a tight range below $4,500 as trading volumes thin out ahead of the Christmas break. The US Dollar selling bias remains unabated on the back of dovish Fed expectations, which continues to act as a tailwind for the bullion amid persistent geopolitical risks.

Bitcoin slips below $87,000 as ETF outflows intensify, whale participation declines

Bitcoin price continues to trade around $86,770 on Wednesday, after failing to break above the $90,000 resistance. US-listed spot ETFs record an outflow of $188.64 million on Tuesday, marking the fourth consecutive day of withdrawals.

Economic outlook 2026-2027 in advanced countries: Solidity test

After a year marked by global economic resilience and ending on a note of optimism, 2026 looks promising and could be a year of solid economic performance. In our baseline scenario, we expect most of the supportive factors at work in 2025 to continue to play a role in 2026.

Avalanche struggles near $12 as Grayscale files updated form for ETF

Avalanche trades close to $12 by press time on Wednesday, extending the nearly 2% drop from the previous day. Grayscale filed an updated form to convert its Avalanche-focused Trust into an ETF with the US Securities and Exchange Commission.